Visualization of 3D data
Summary
This tutorial shows different approaches to visualize 3D microscopy data in Fiji (Schindelin et al. 2012). It provides a quick introduction to some of the tools bundled in Fiji, such as Orthogonal Views, Volume Viewer, 3D Viewer (Schmid et al. 2010), and BigDataViewer (Pietzsch et al. 2015), and a more in-depth explanation of the plugin 3Dscript (Schmid et al. 2019).
Requirements
- Fiji (Schindelin et al. 2012)
- 3Dscript plugin (Schmid et al. 2019)
- Fly Embryo Timelapse Lightsheet dataset (4x downsampled) (Vellutini 2025)
Setup
Install Fiji
- Go to https://fiji.sc, choose
Distribution: Stable, and click the download button. - Copy the downloaded archive to your working directory and unzip it.
- Open the
Fiji.appdirectory and double-click on the launcher. - The main window of Fiji will open.
Install 3Dscript
- Click on
Help>Update...and wait. - Click on
Manage Update Sites. - A list of plugins will open.
- Search for
3Dscriptand click on the checkbox. - Click
Apply and Closeand thenApply Changes. - Wait until the downloads are finished. Then, click
OK. - Restart Fiji (close it and double-click the launcher).
- Check if
3Dscriptis installed underPlugins>3Dscript. - You are ready!
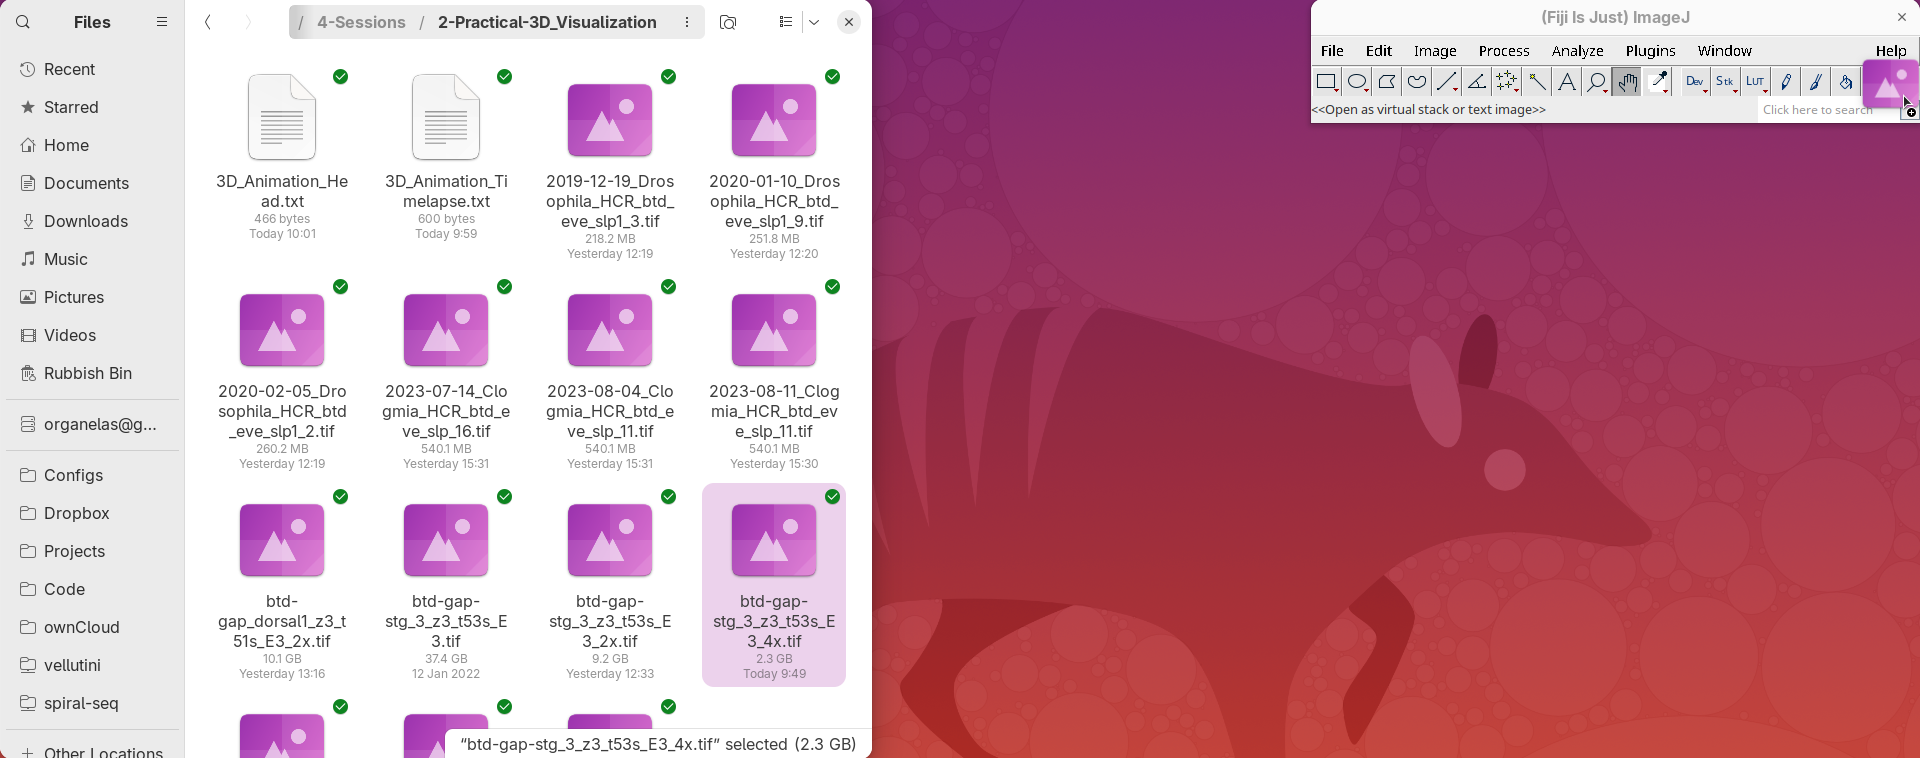
Download 3D datasets
T1 Head (16-bits)dataset is included in Fiji; no need to download in advance.btd-gap-stg_3_z3_t53s_E3_4x.tifdataset from this Zenodo repository (Vellutini 2025). The direct link to the file is here (2.3GB).
Open dataset
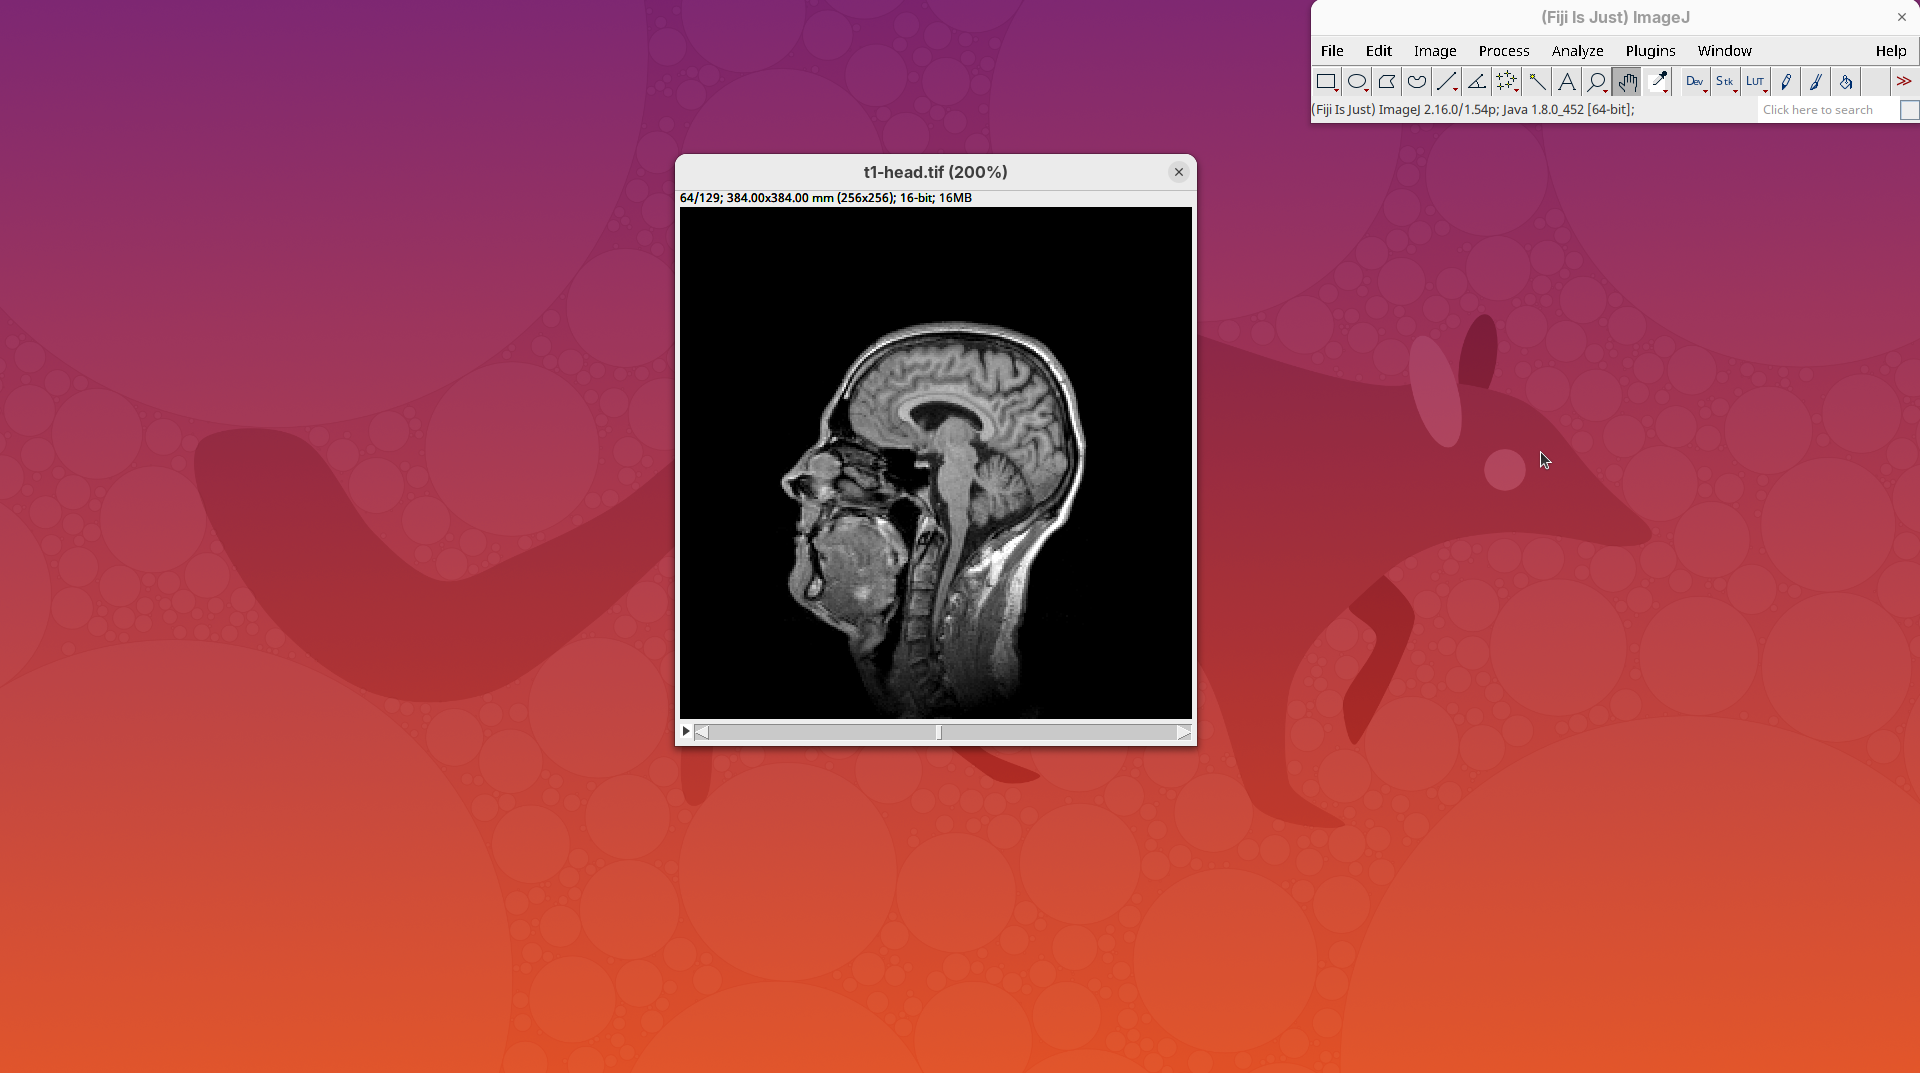
We will begin by visualizing an MRI dataset of a human head that is bundled in Fiji.
- Go to
File>Open Samples>T1 Head (16-bits).
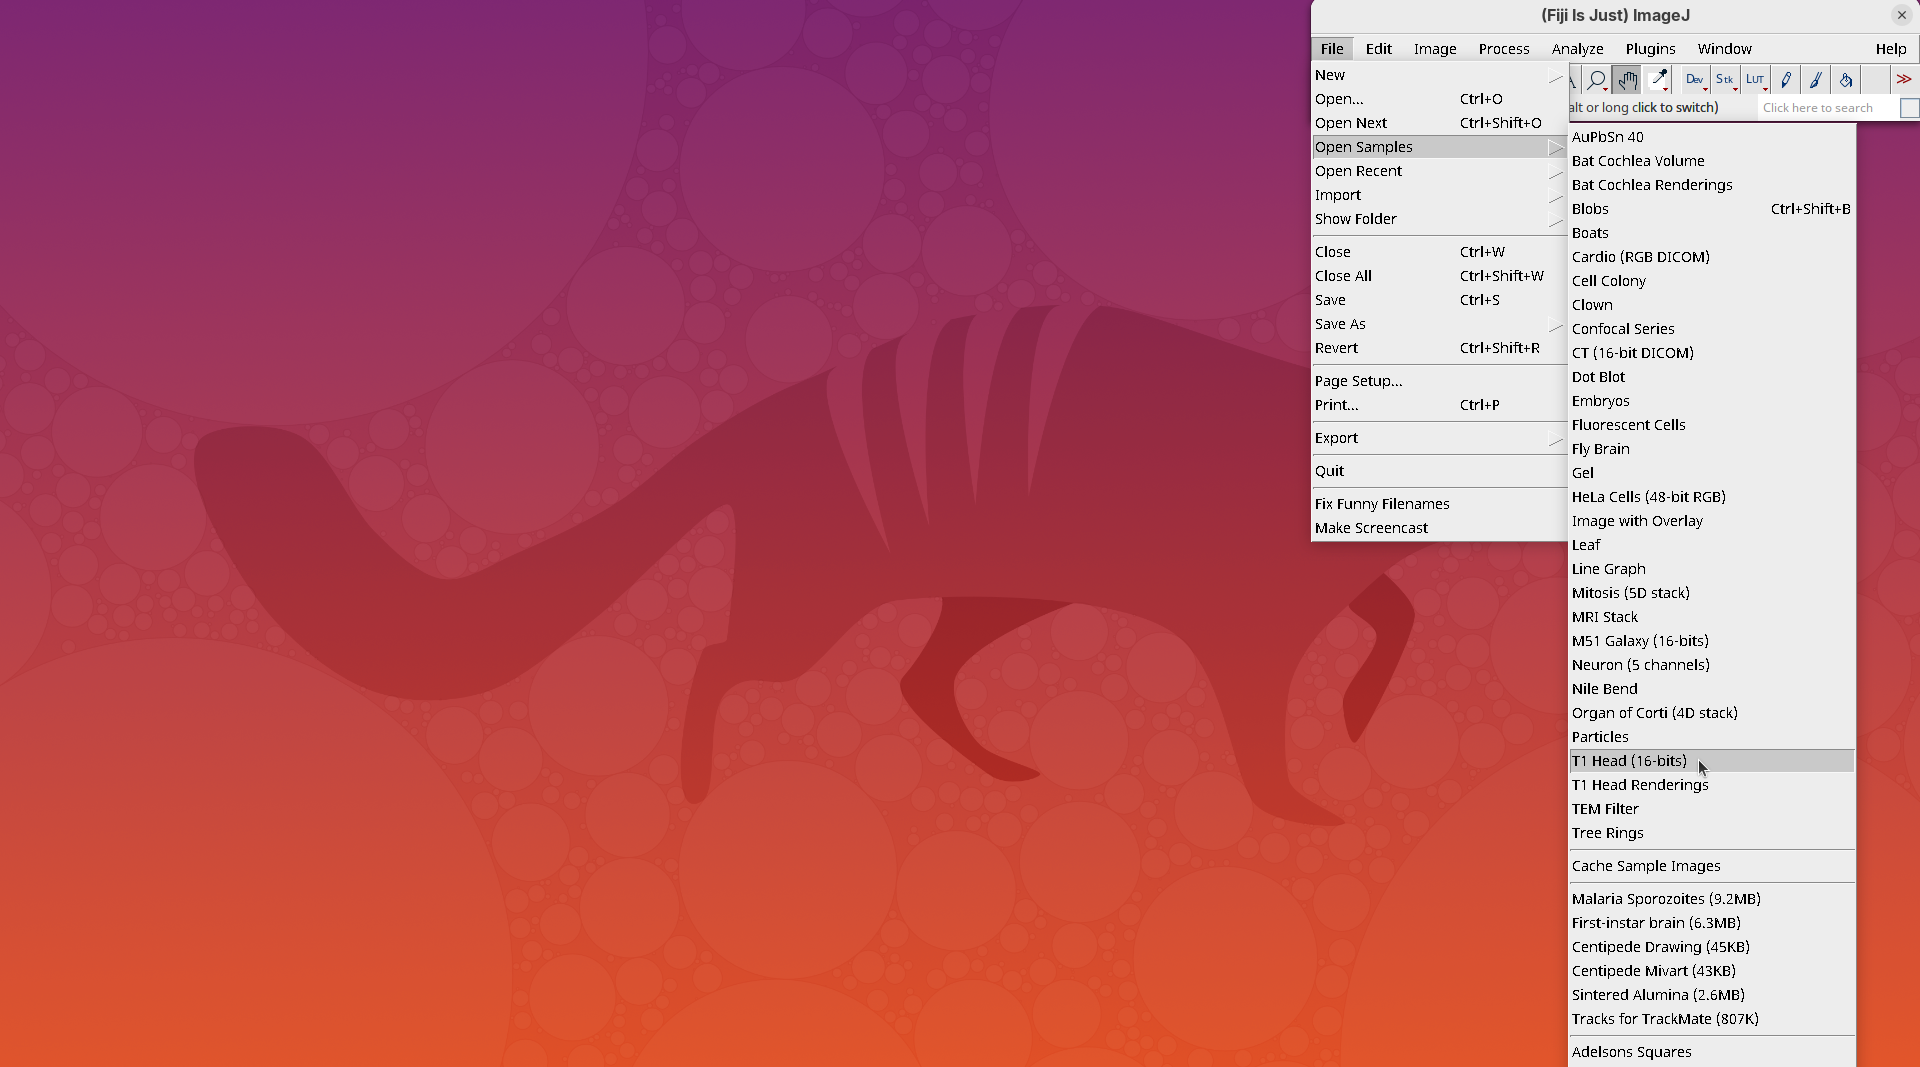
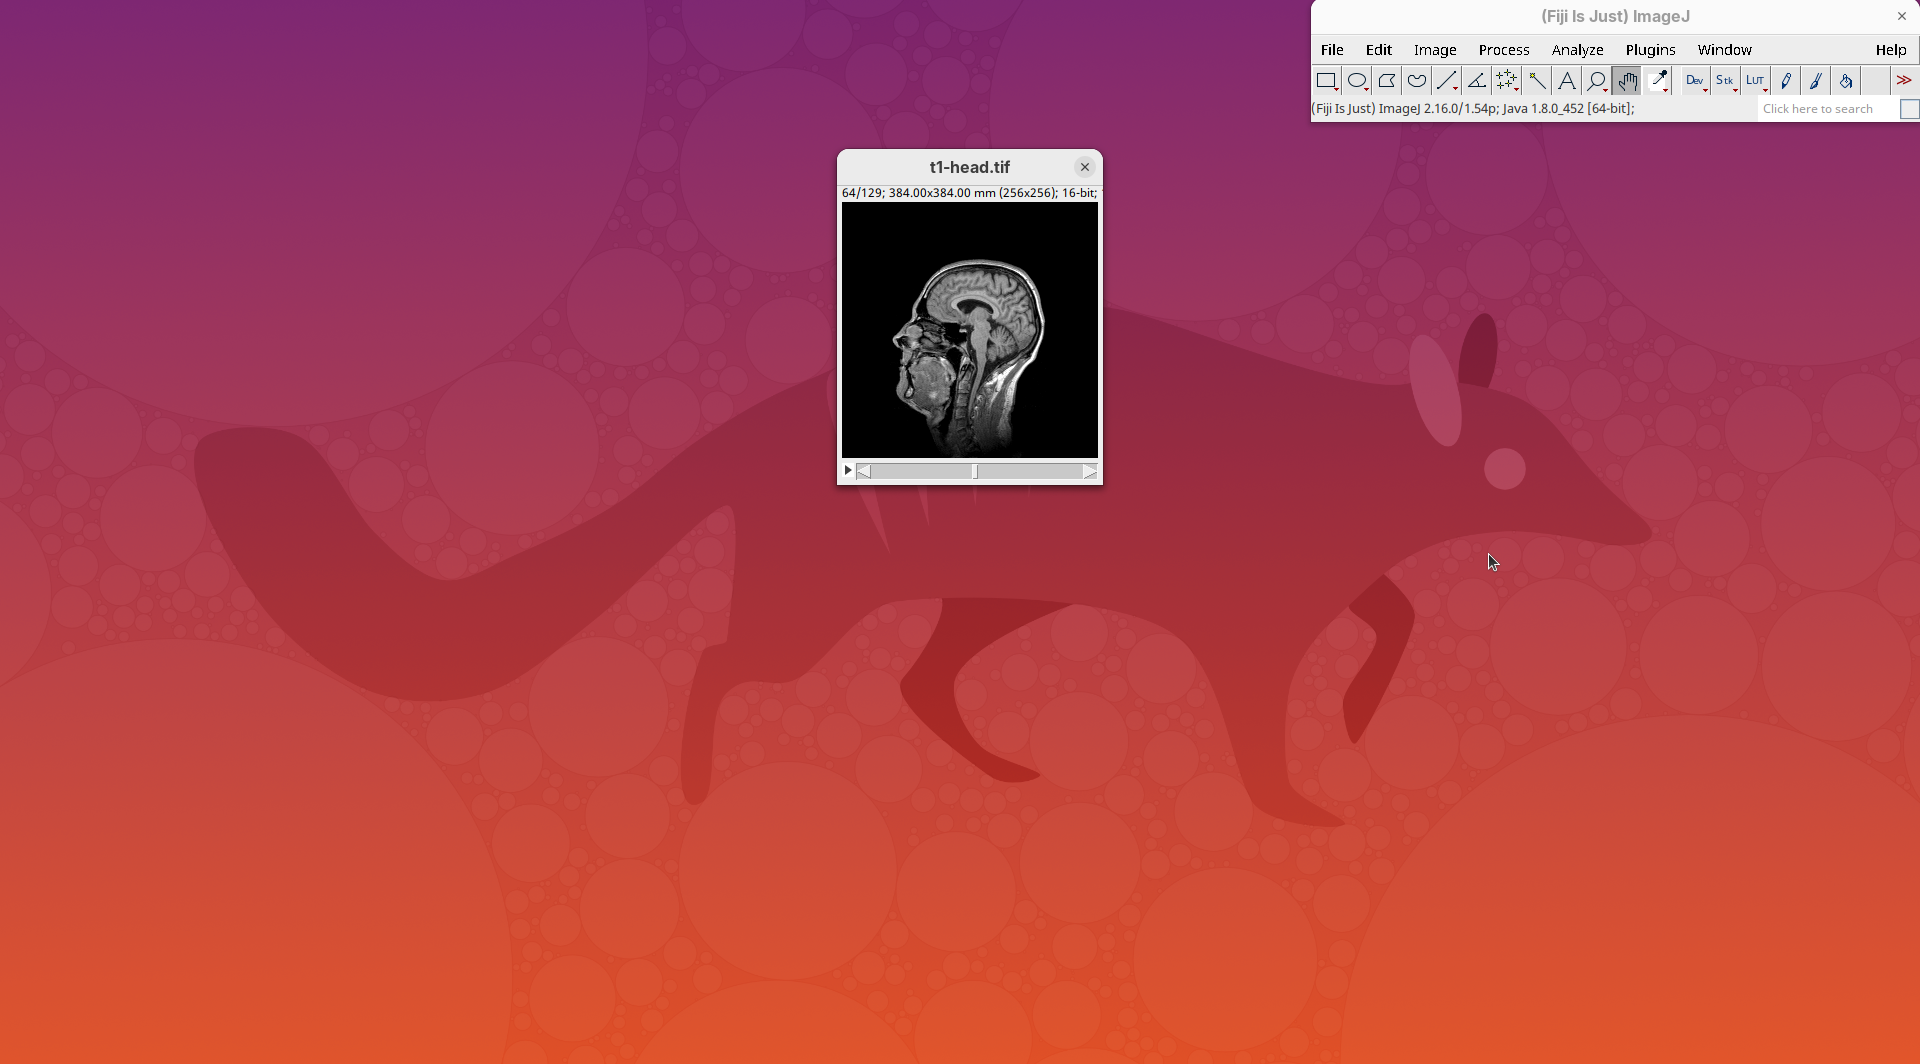
- Increase the zoom to 200% for better visualization.
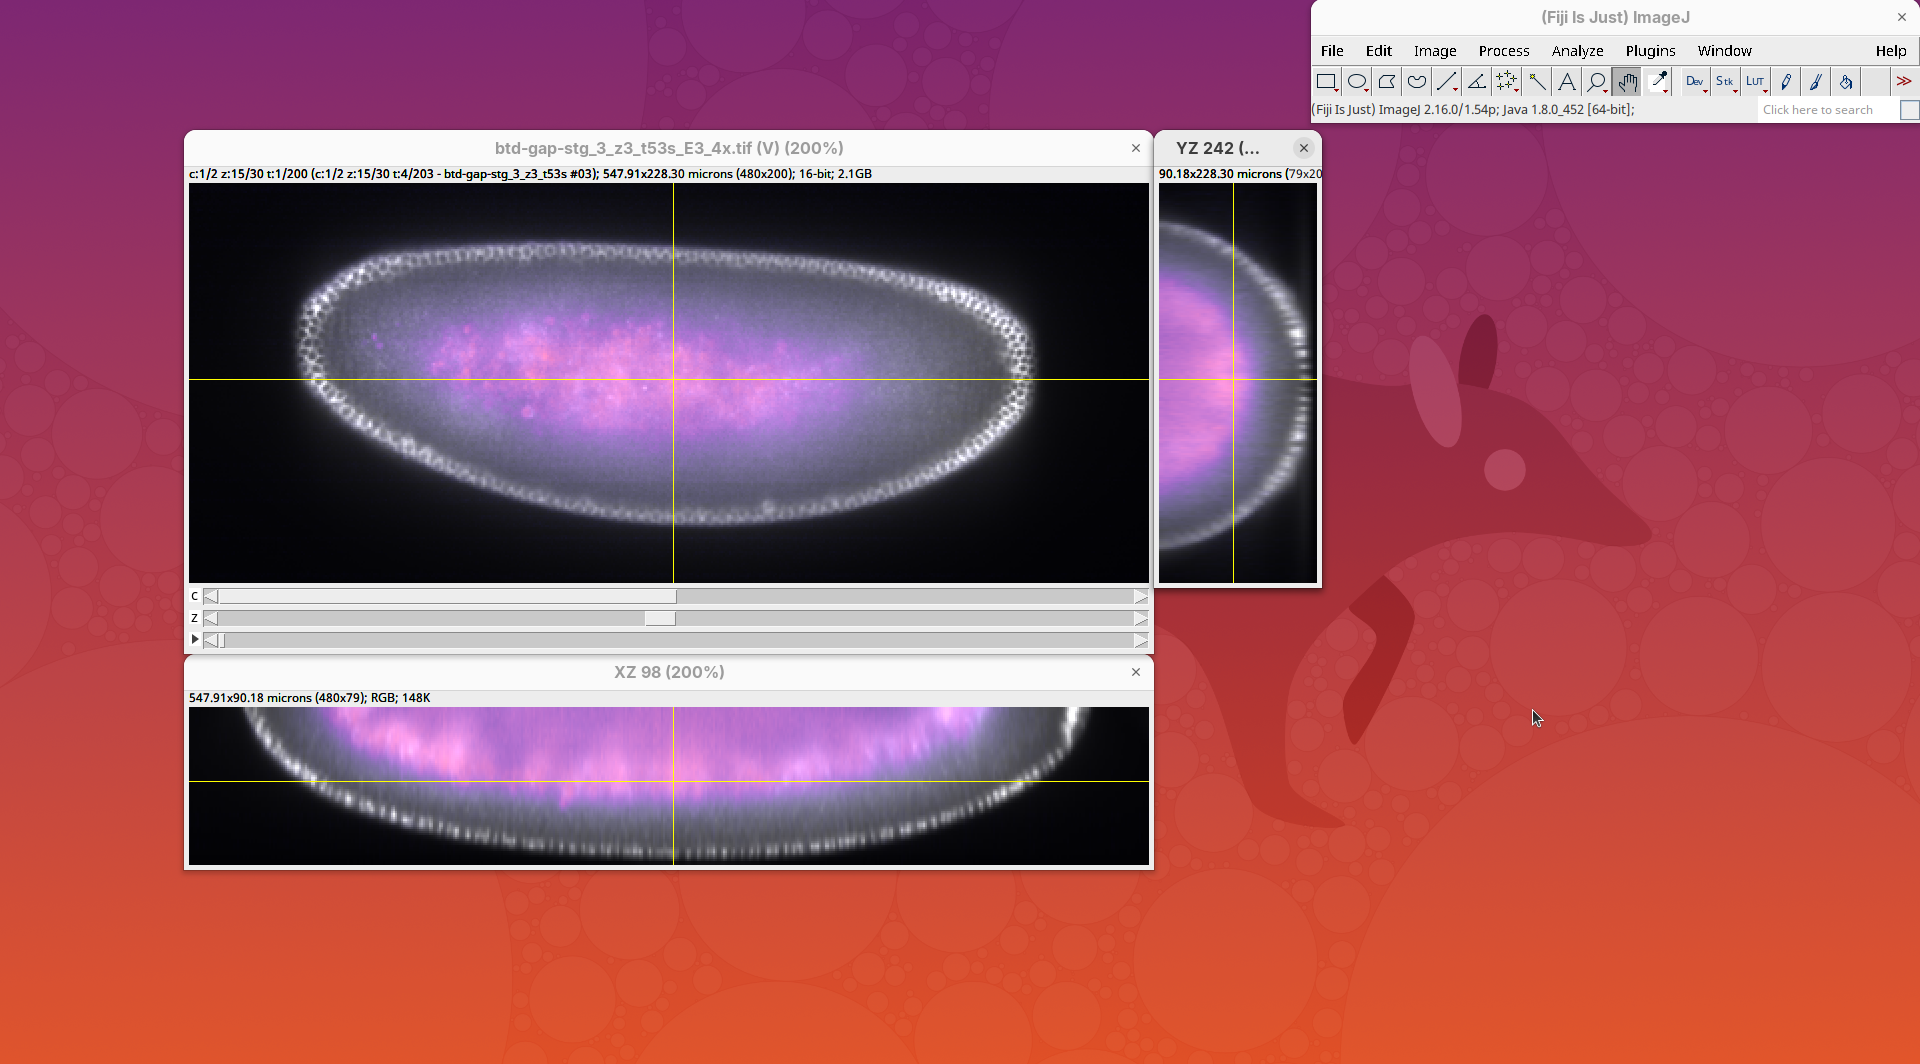
Orthogonal Views
Orthogonal Views is a tool that shows the optical sections through the orthogonal planes of XY: XZ and YZ. It is an easy and quick way to get a sense of the tridimensionality of your dataset. Whenever I’m opening a dataset for the first time I use Orthogonal Views. To activate it:
- Click on
Image>Stacks>Orthogonal Views(or pressCtrl+Shift+H). - The XZ and YZ panels will open next to your XY stack.
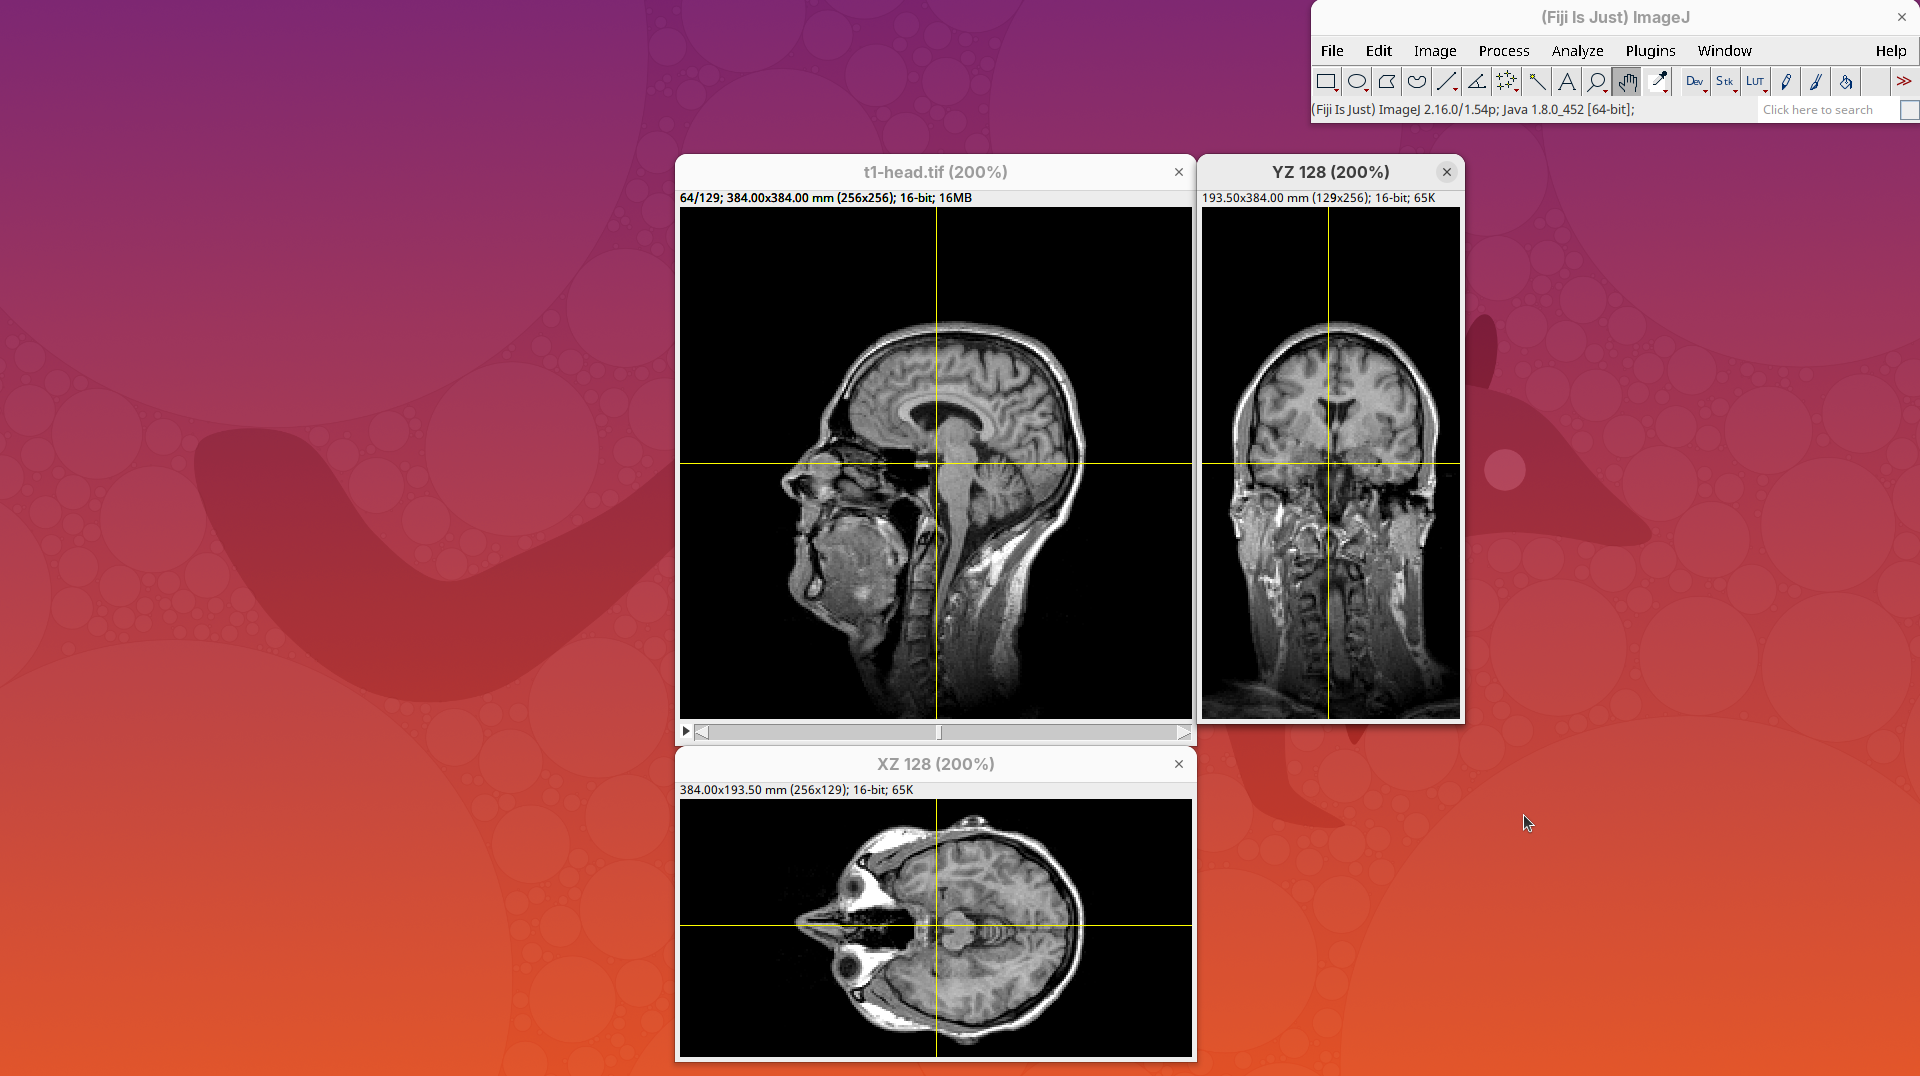
- The yellow lines are synchronized between the panels.
- Click around the different parts of the head to inspect the same position under different angles.
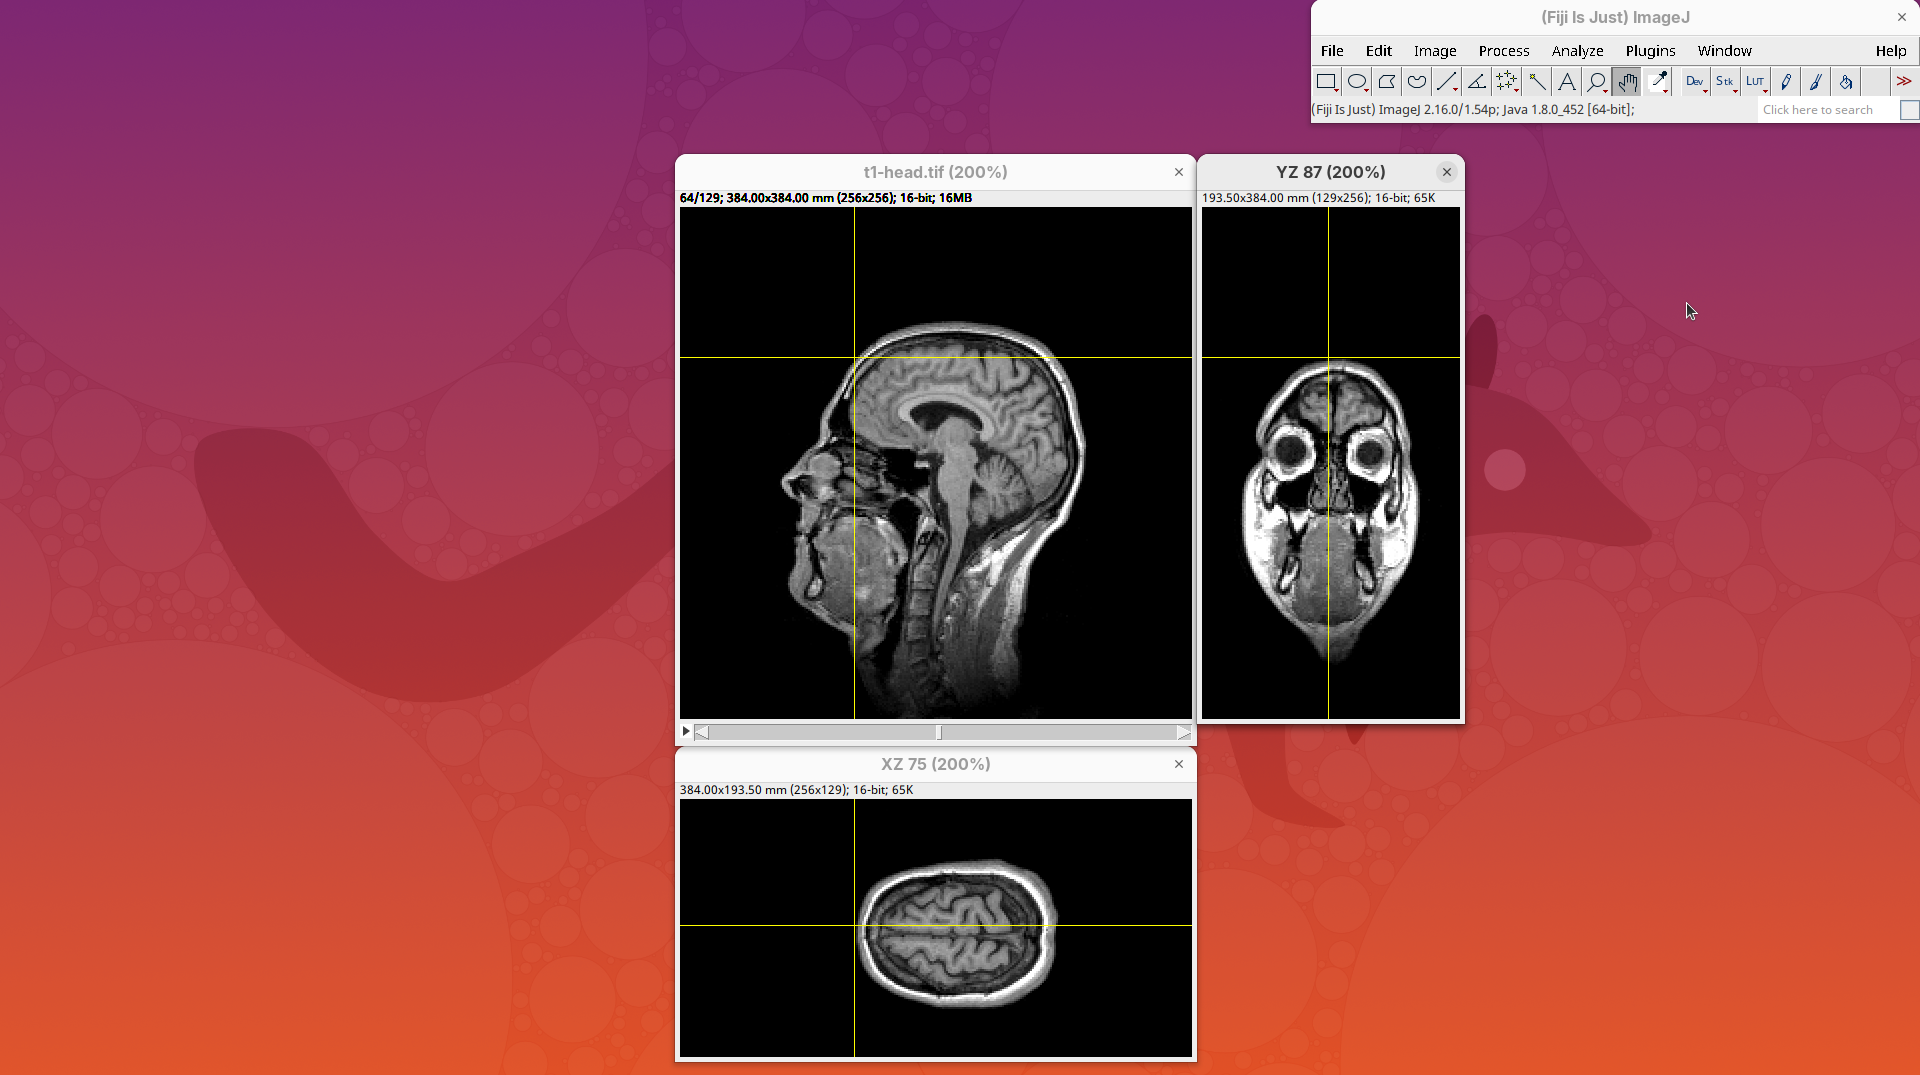
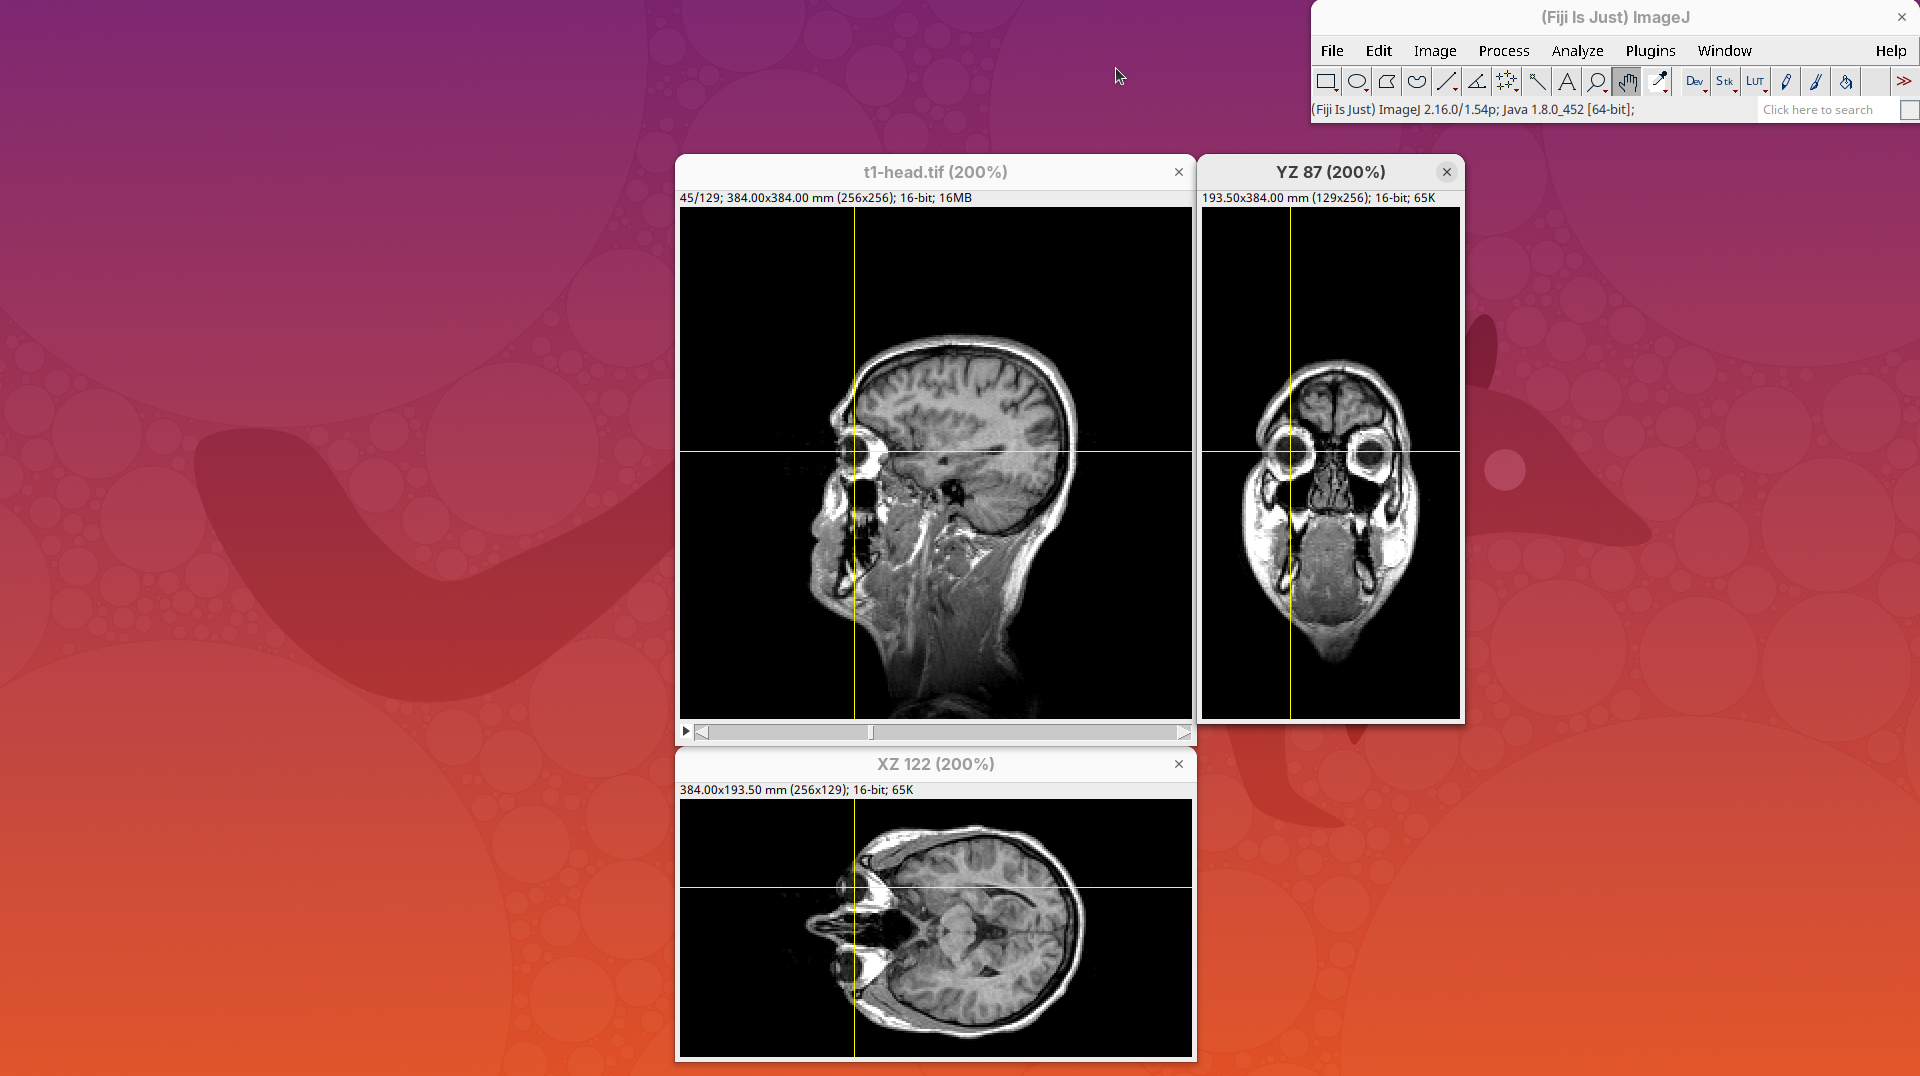
Orthogonal Views is a great way to start understanding your 3D data.
Volume Viewer
Volume Viewer is a more powerful plugin for 3D visualization as it supports slicing, projections, and rendering. The interface is interactive and intuitive to use. To open it:
- Go to
Plugins>Volume Viewer. The main interface will open in theSlicemode.
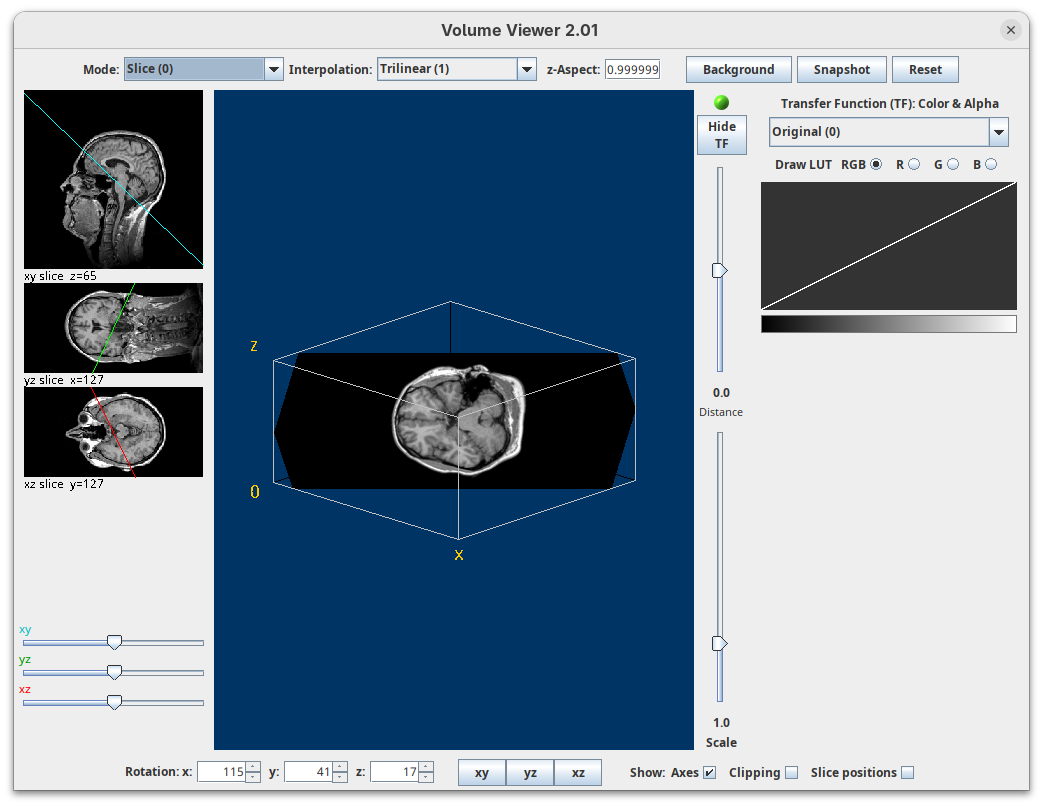
- Click around and move the sample to see optical sections from different angles.
- Then, activate the
Volumemode to render the sample’s surface in 3D and explore it as well, playing with the different rendering parameters.
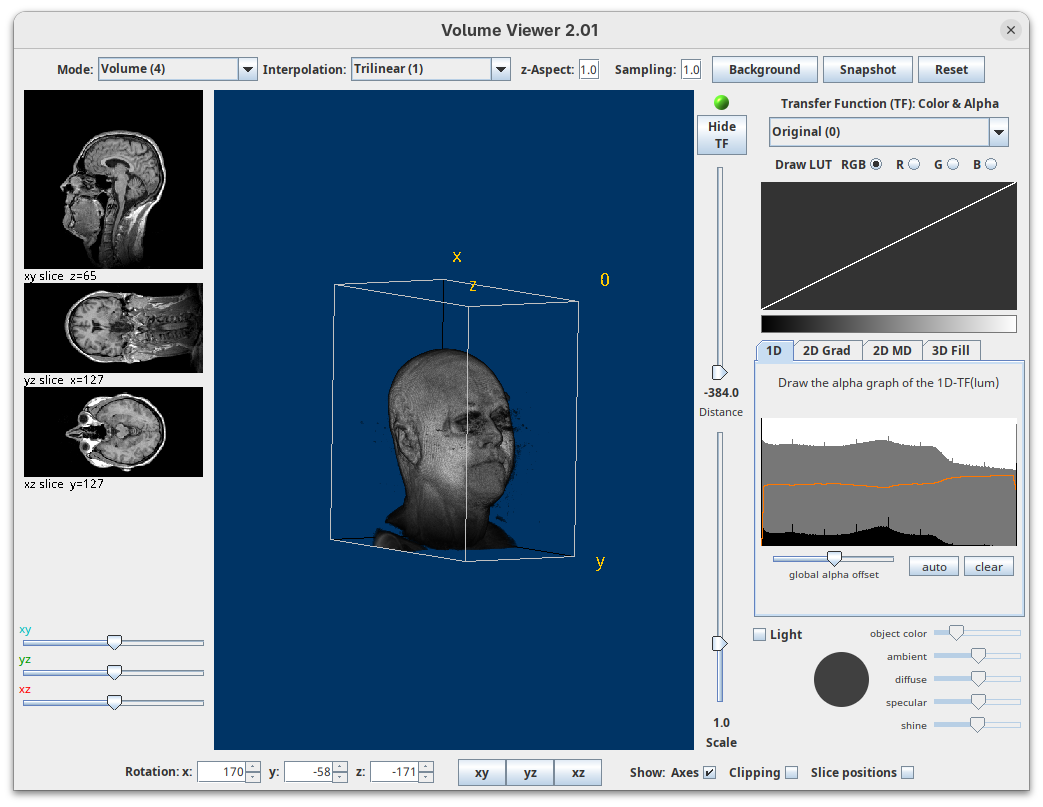
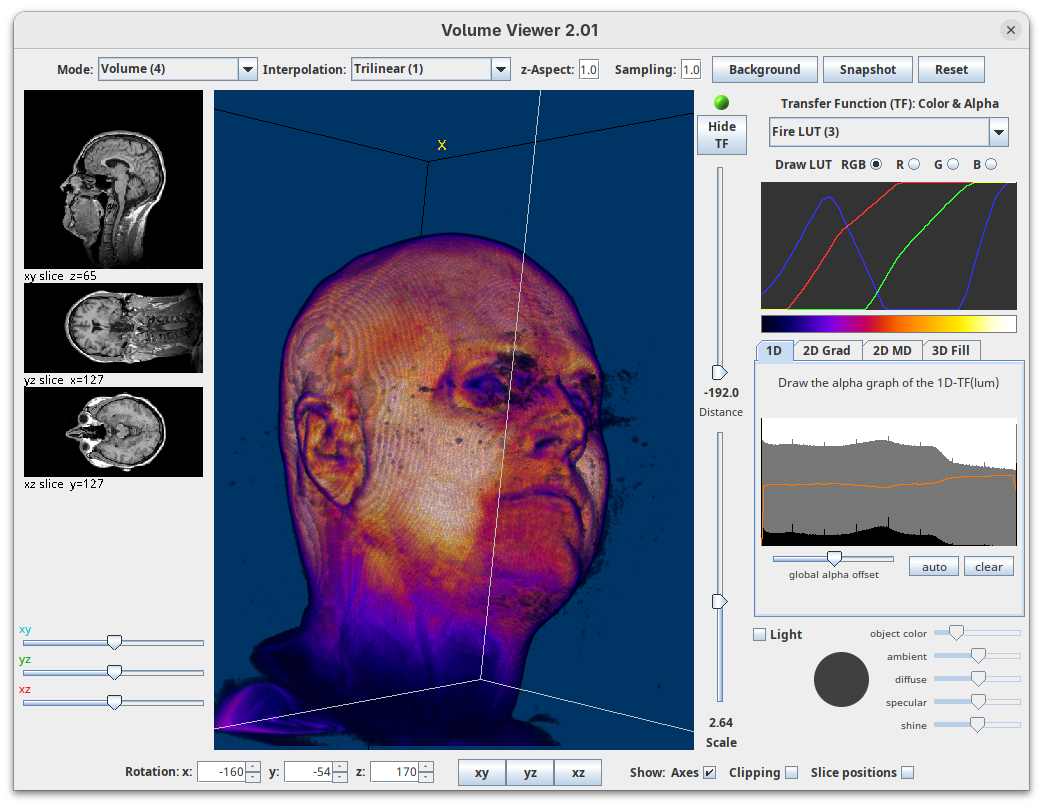
Volume Viewer also provides a way to take snapshots of the current view.
BigDataViewer
BigDataViewer (Pietzsch et al. 2015) is one of the most important tools for visualizing large, multidimensional datasets. It provides a simple and intuitive interface and shortcuts to swiftly navigate through your sample even on a regular laptop. This is possible because of the underlying file format used by BigDataViewer: the XML/HDF5 combo. Therefore, before opening the plugin, we must convert our dataset.
- Go to
Plugins>BigDataViewer>Export Current Image as XML/HDF5.
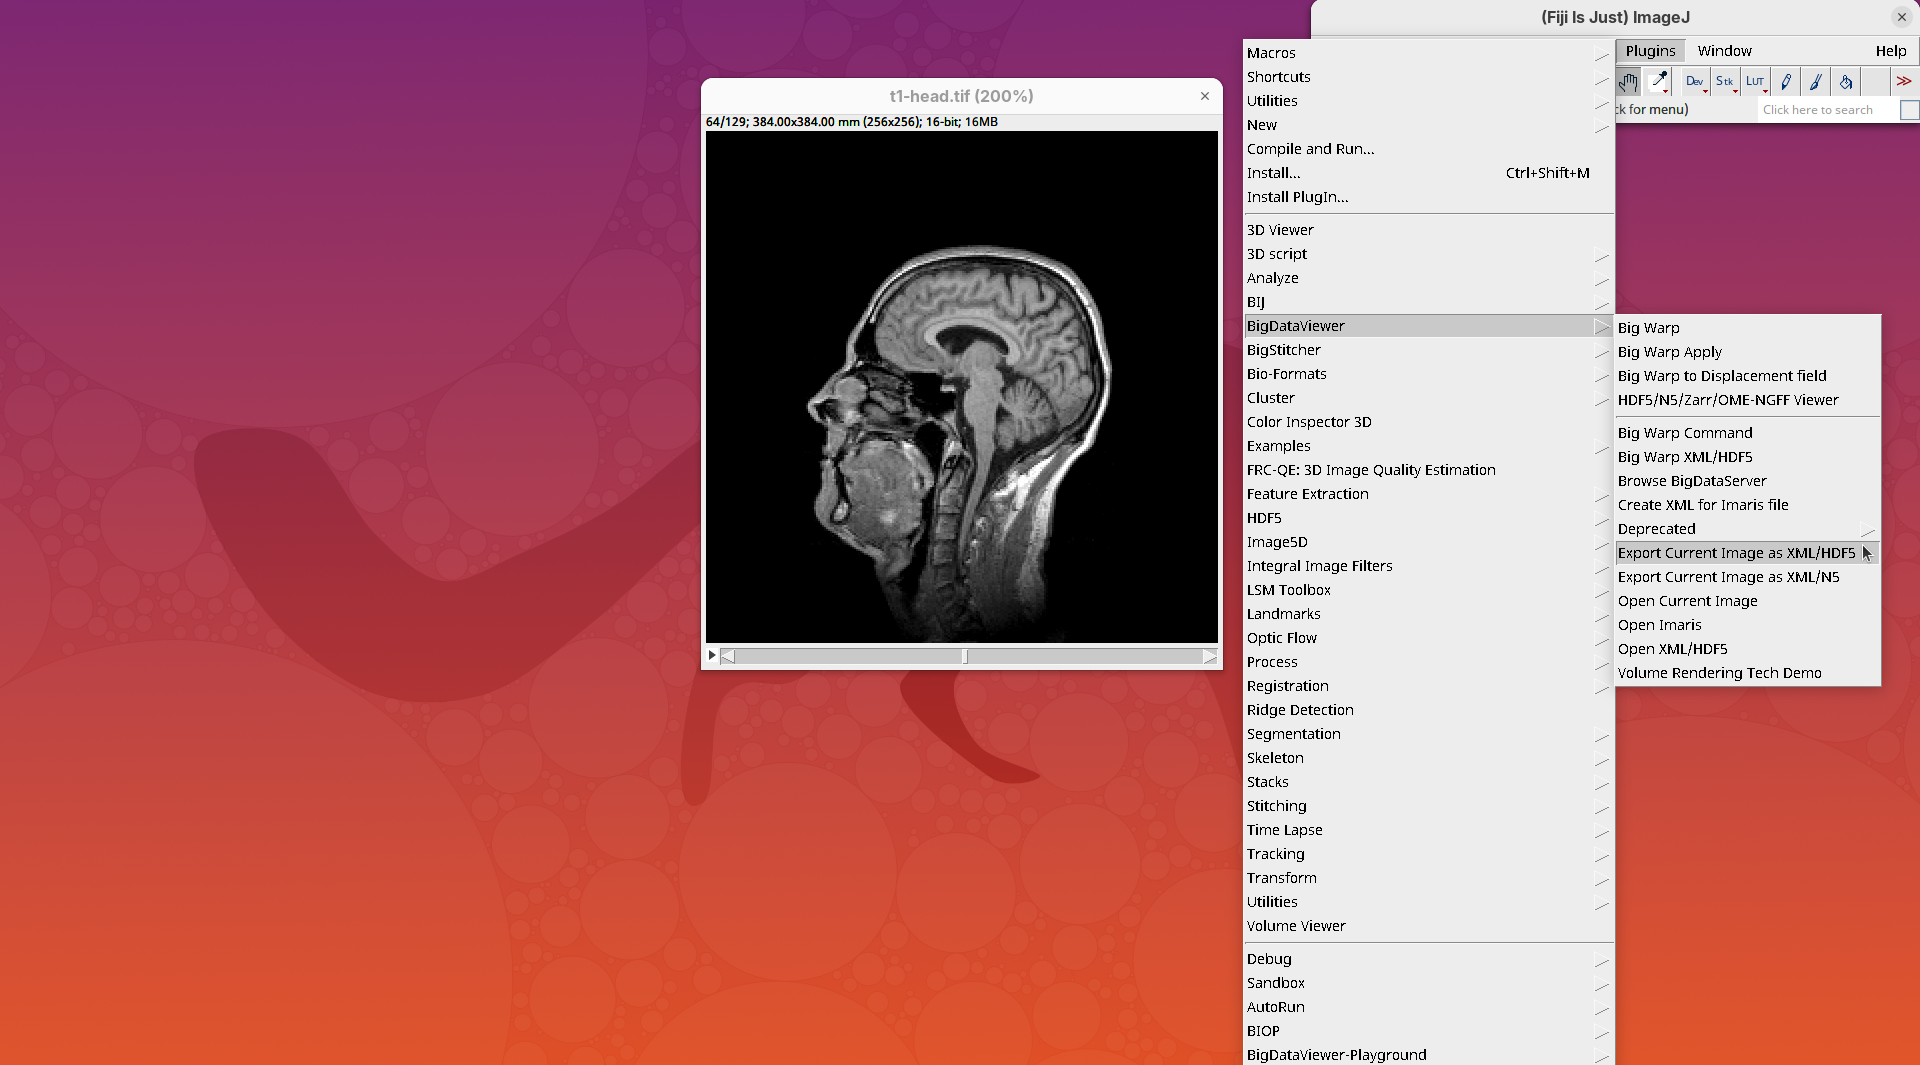
A dialog with export options will open.
- Under
Export path, click onBrowseto select the output directory fort1-head.xml.
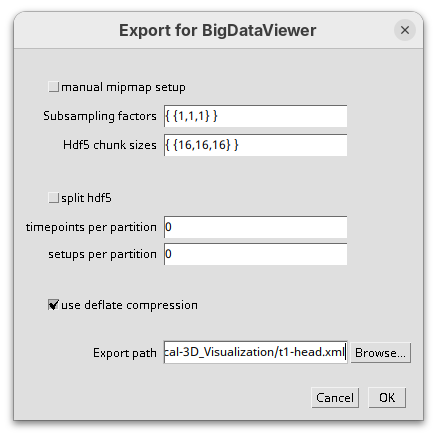
The export process will start. Since this is a small dataset, it’ll be fast. But, for large datasets, this can take hours.
When done, you will find two new files in your working directory: t1-head.xml and t1-head.h5.
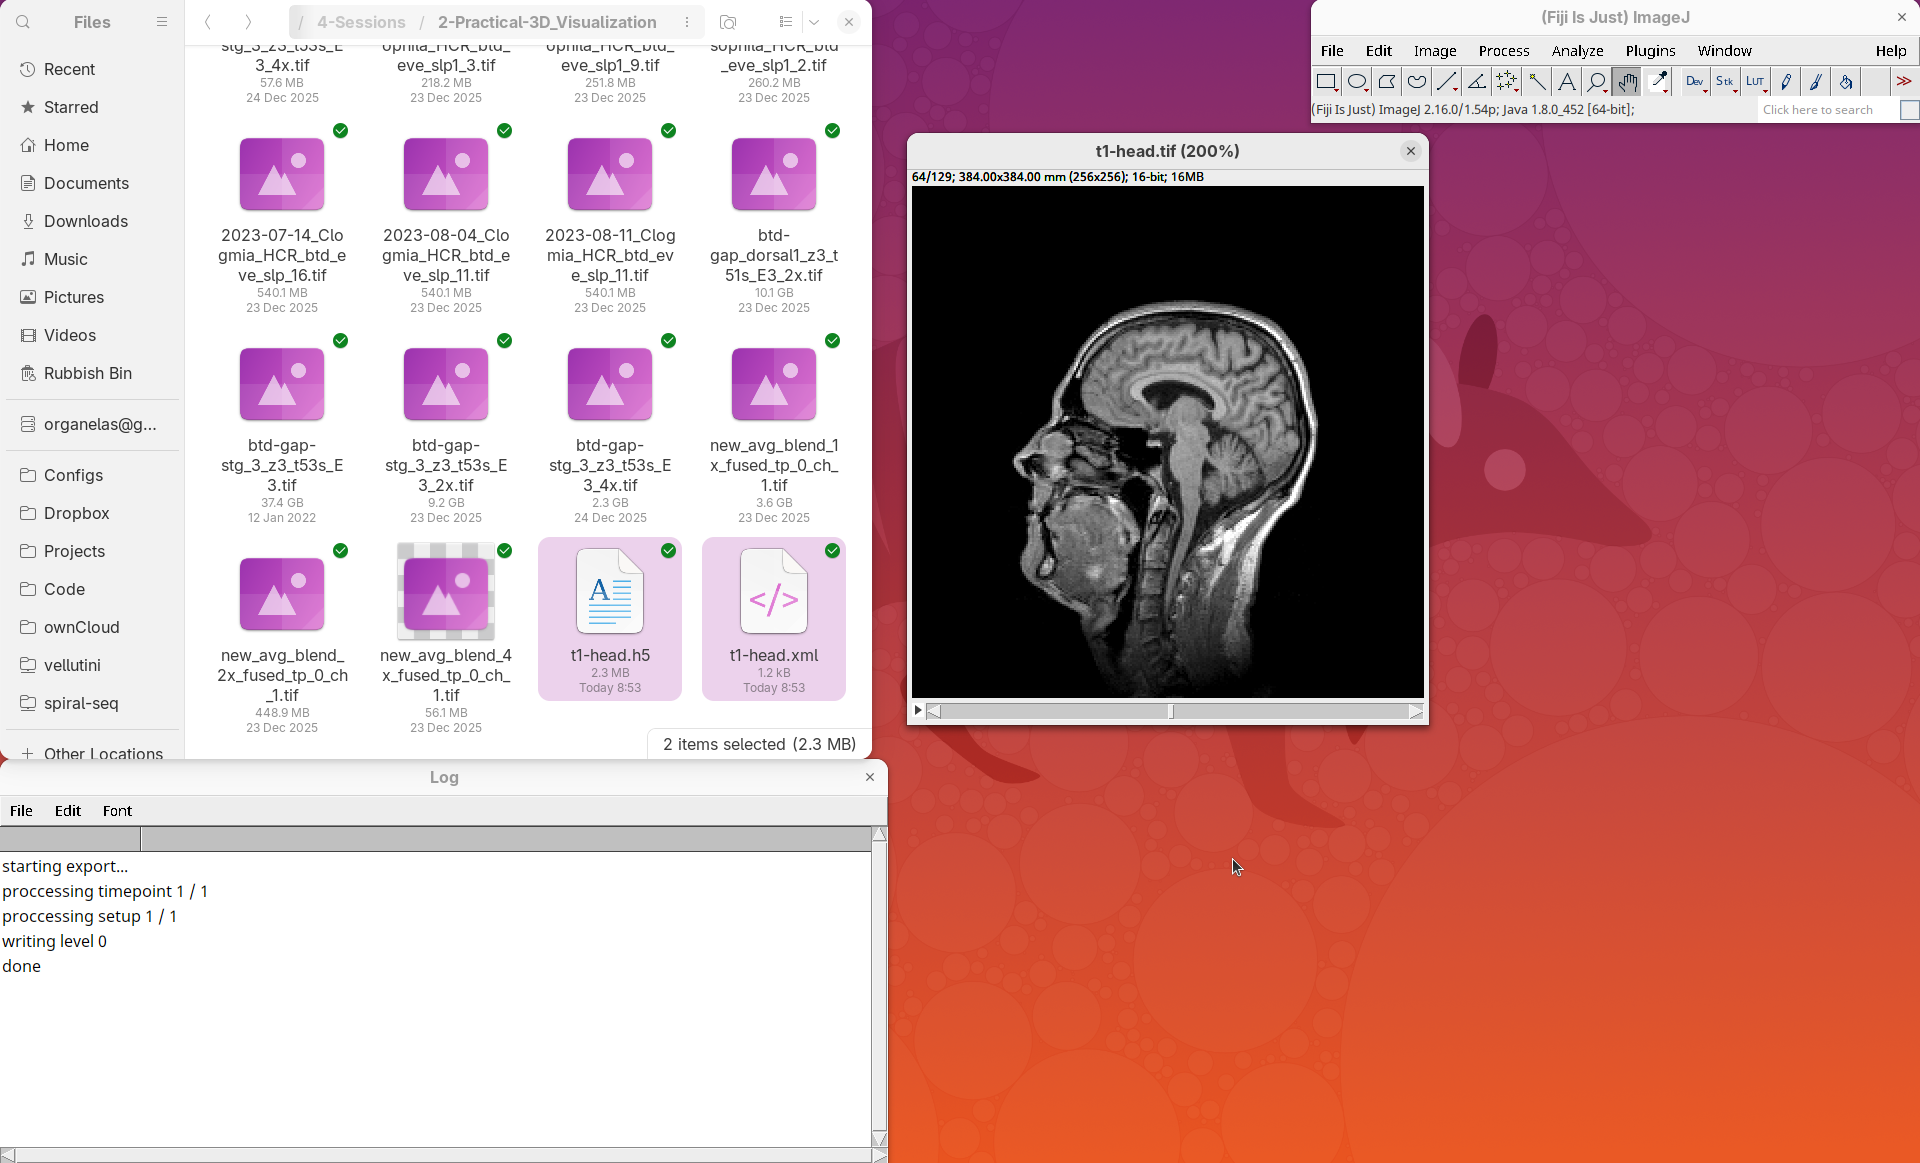
The XML file stores metadata information about the image. The HDF5 file stores actual image data. These two files will always be in a pair. To open the XML/HDF5:
- Go to
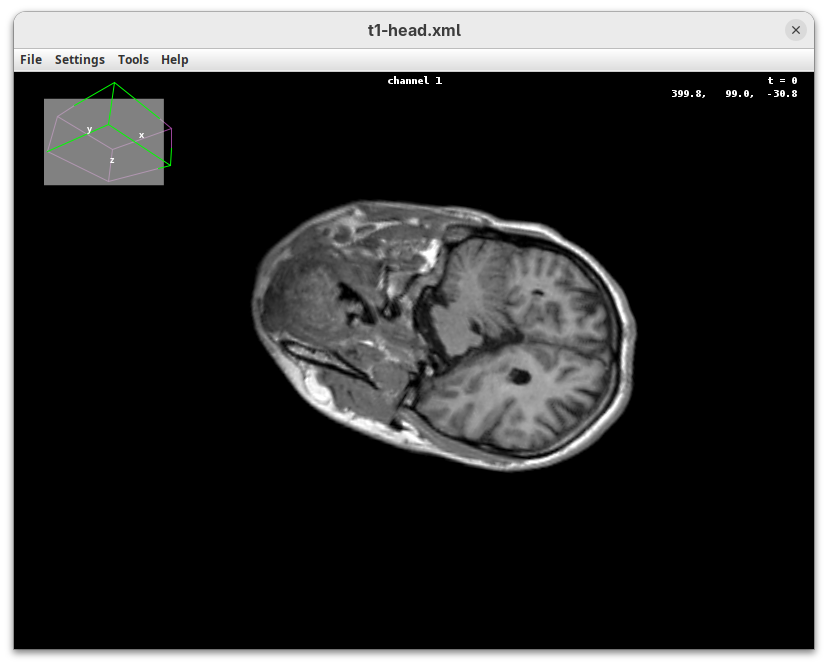
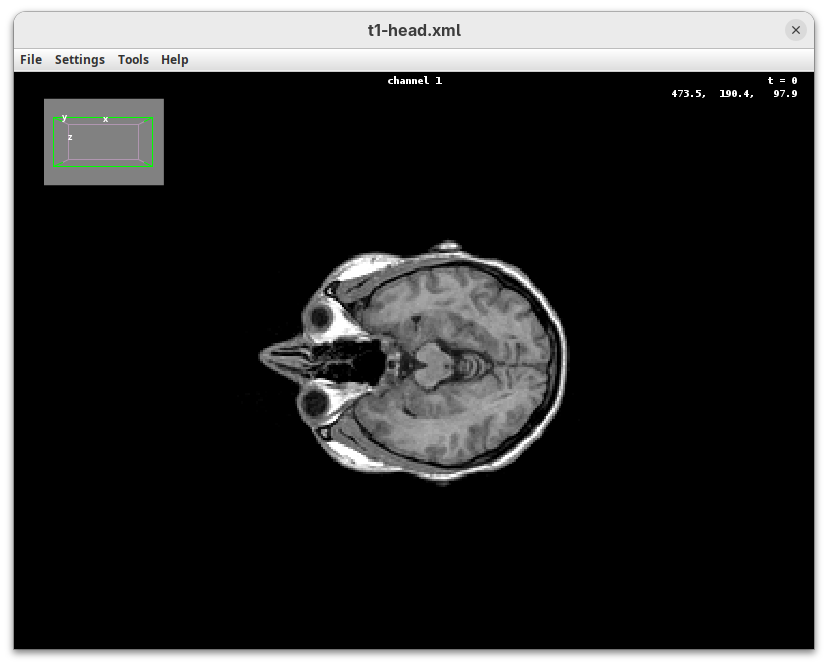
Plugins>BigDataViewer>Open XML/HDF5and select thet1-head.xml.
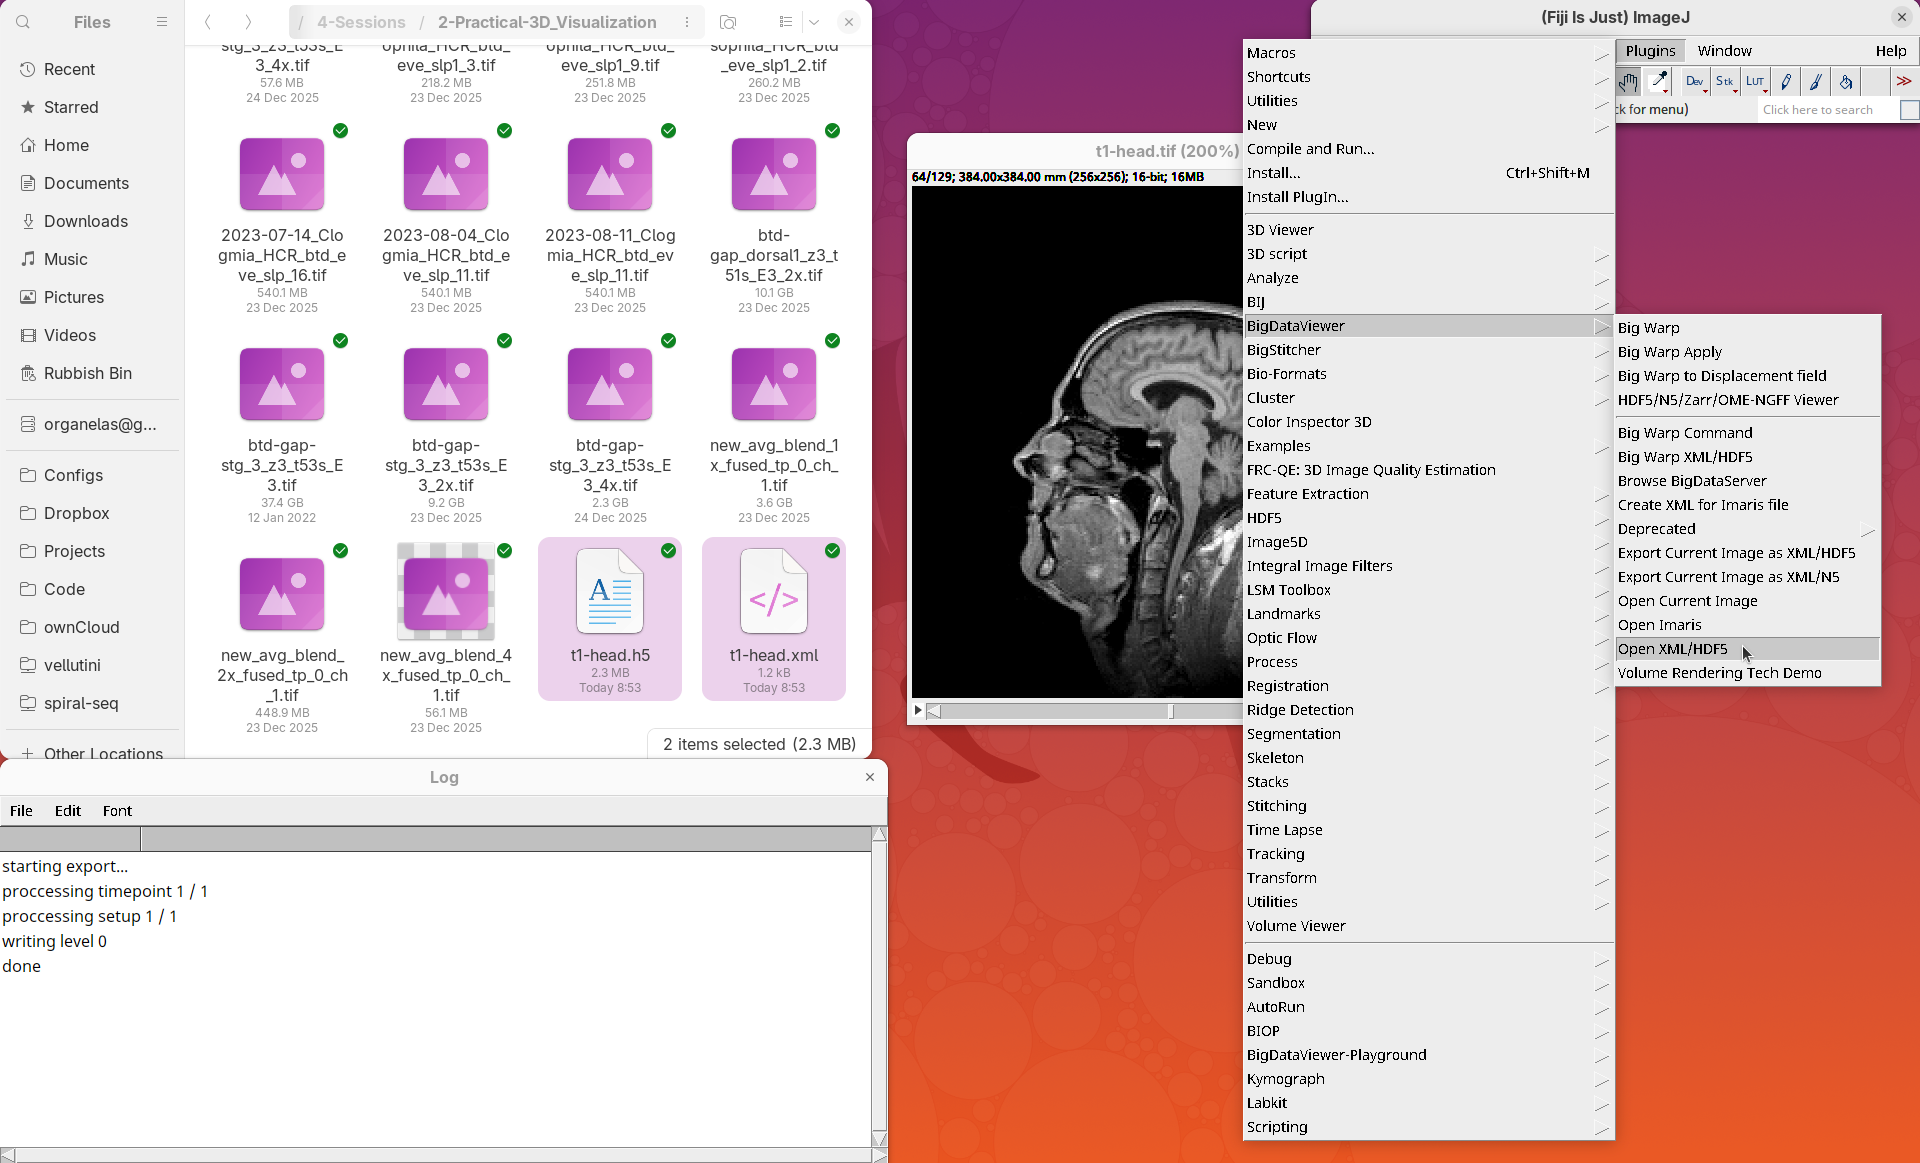
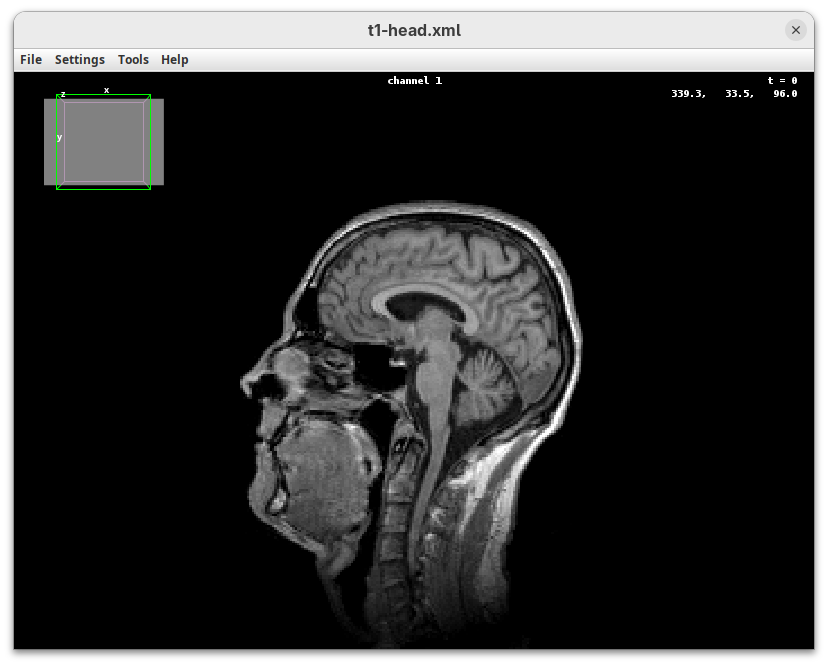
The BigDataViewer interface will open showing an optical section of the head sample.
Getting familiar with BigDataViewer is an essential skill for navigating large 3D datasets. It’ll also be important for the multiview registration pipeline. So, take the time to learn the basic commands and shortcuts. It is nicely intuitive. The BigDataViewer’s page on the ImageJ Docs has the official documentation and we can also go to Help > Show Help for an up-to-date overview.
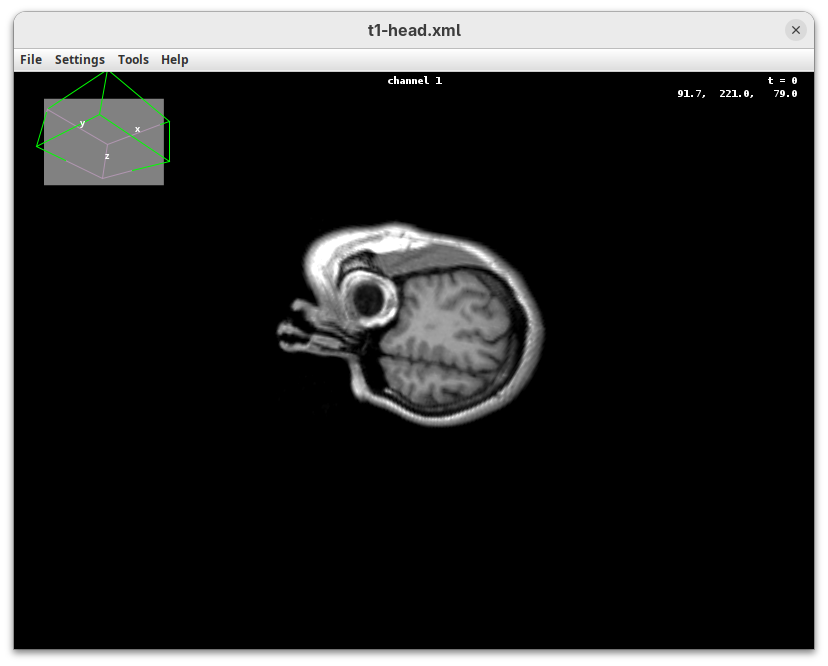
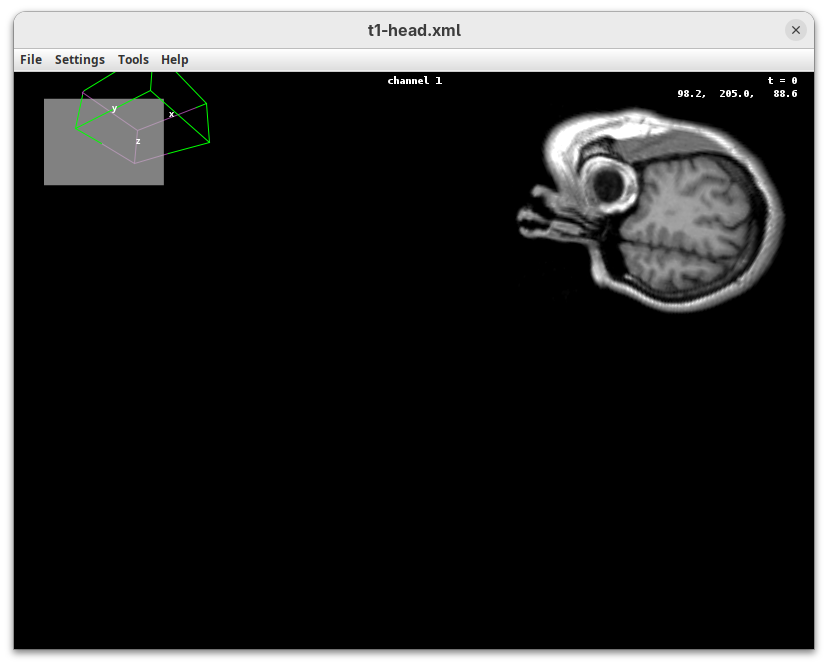
Some of the movements to try:
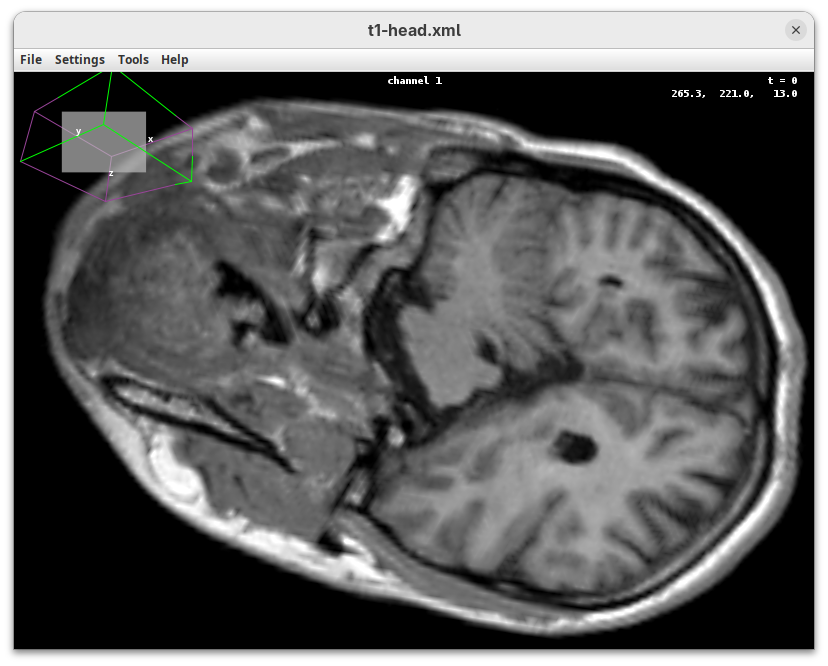
Left-click and drag: turn the sample around the mouse pointer at any arbitrary angle.Right-click and drag: move the sample in the XY plane (of the view).Scroll: move through the Z plane (of the view). UseShift+Scrollto move fast.Ctrl+Shift+Scroll: zoom in or out.
But, most importantly, are the commands to put your sample back to its original orientation or along any of the original dimension axes:
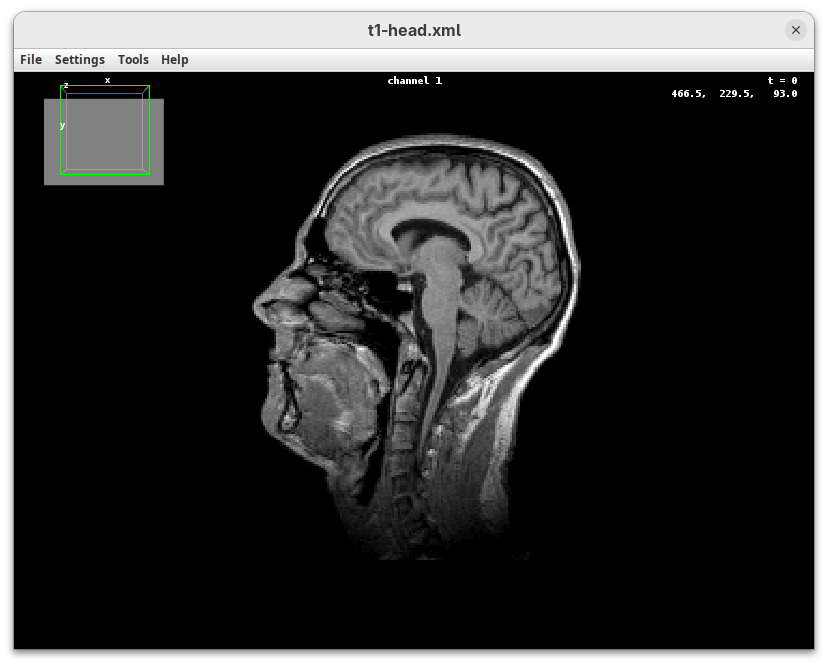
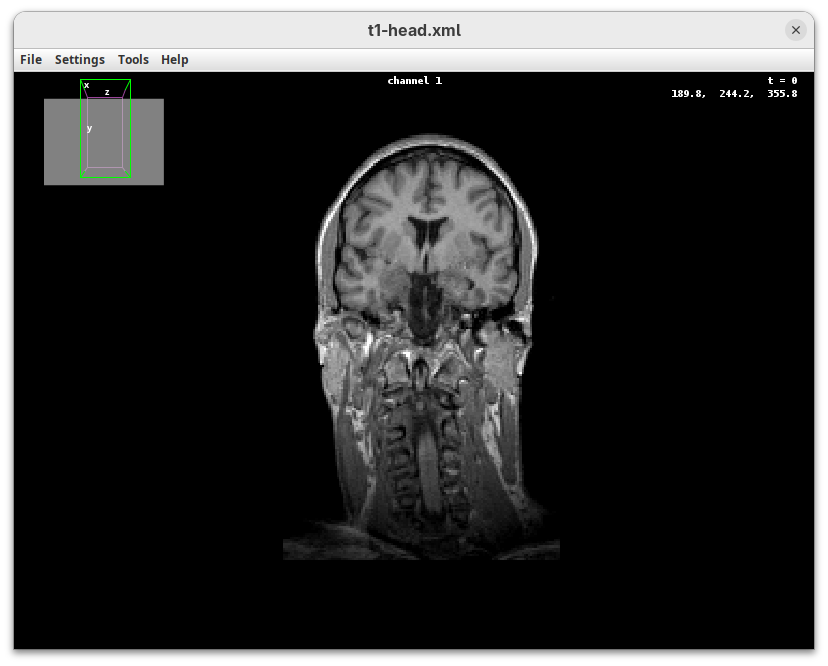
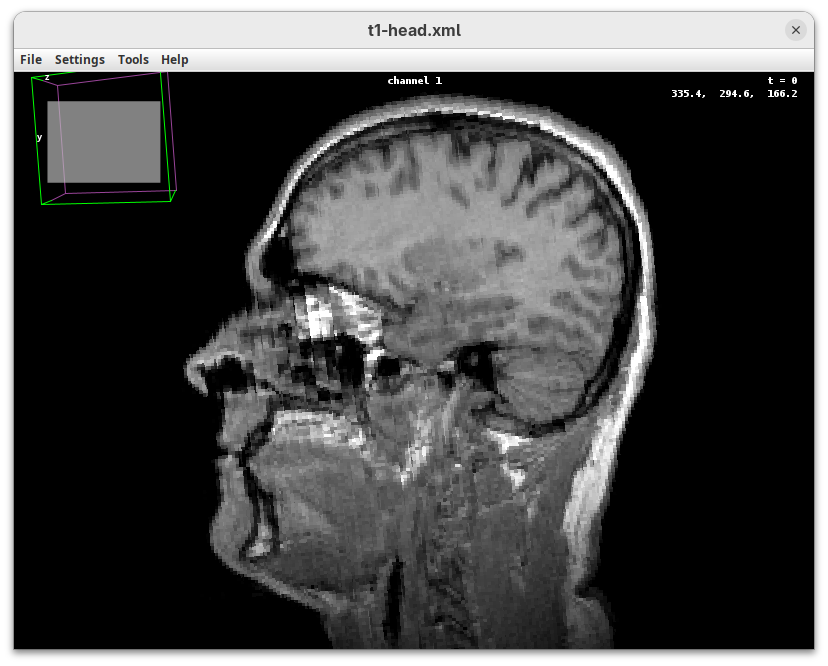
Shift+Z: orient the sample on the XY plane.Shift+X: orient the sample on the ZY plane.Shift+Y: orient the sample on the ZX plane.
Finally, a visual tip. The default interpolation between image slices is nearest-neighbors. Press I to activate the tri-linear interpolation to obtain a much smoother (and improved) data visualization.

3D Project
This is a simple tool to quickly generate a 3D animation (e.g., 360-degree rotation) from an image stack. There are basic parameters for adjusting the rendering, like projection method and opacity, and for controlling the animation. There’s only a bit of documentation. To try:
- Go to
Image>Stacks>3D Project...and clickOKto generate a basic animation.
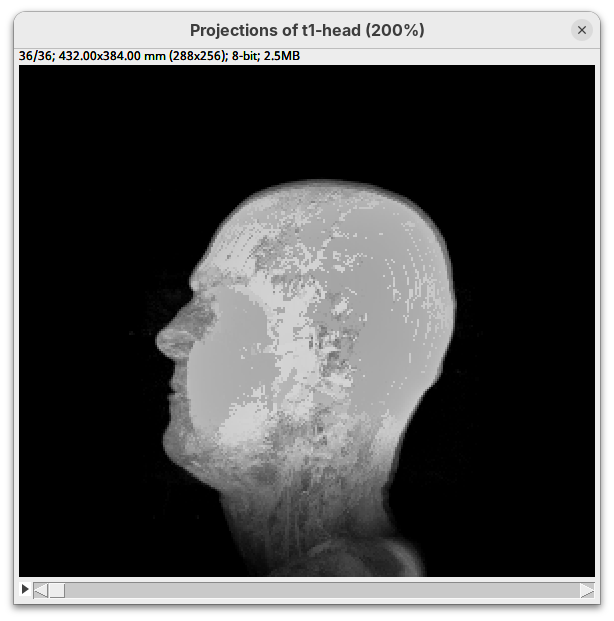
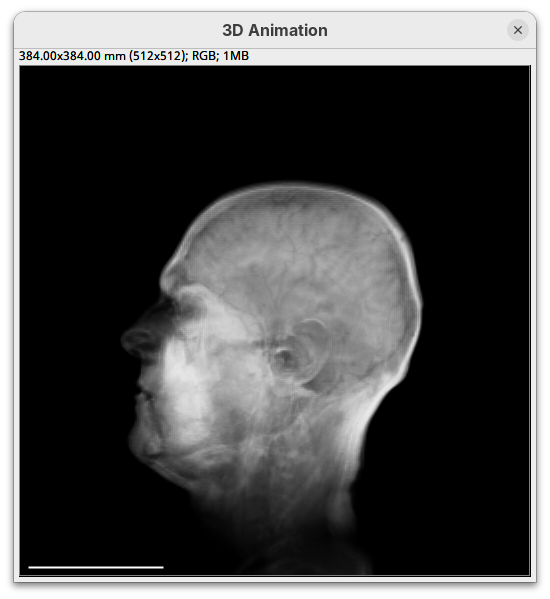
As noticeable above, 3D Project doesn’t do so well with our MRI dataset. However, it works OK for fluorescent microscopy images, so I encourage you to try with other datasets in the future.
3D Viewer
The 3D Viewer (Schmid et al. 2010) is a 3D visualization plugin bundled in Fiji. It has been the default 3D rendering engine for many years and provides a good starting point for visualizing and interacting with 3D images. The interface provides some rendering and animation options, but it is possible to create more advanced visualizations and animations with code. For more details, please consult the documentation.
Here, we’ll only open our dataset with 3D Viewer for visualization.
- Go to
Plugins>3D Viewer.
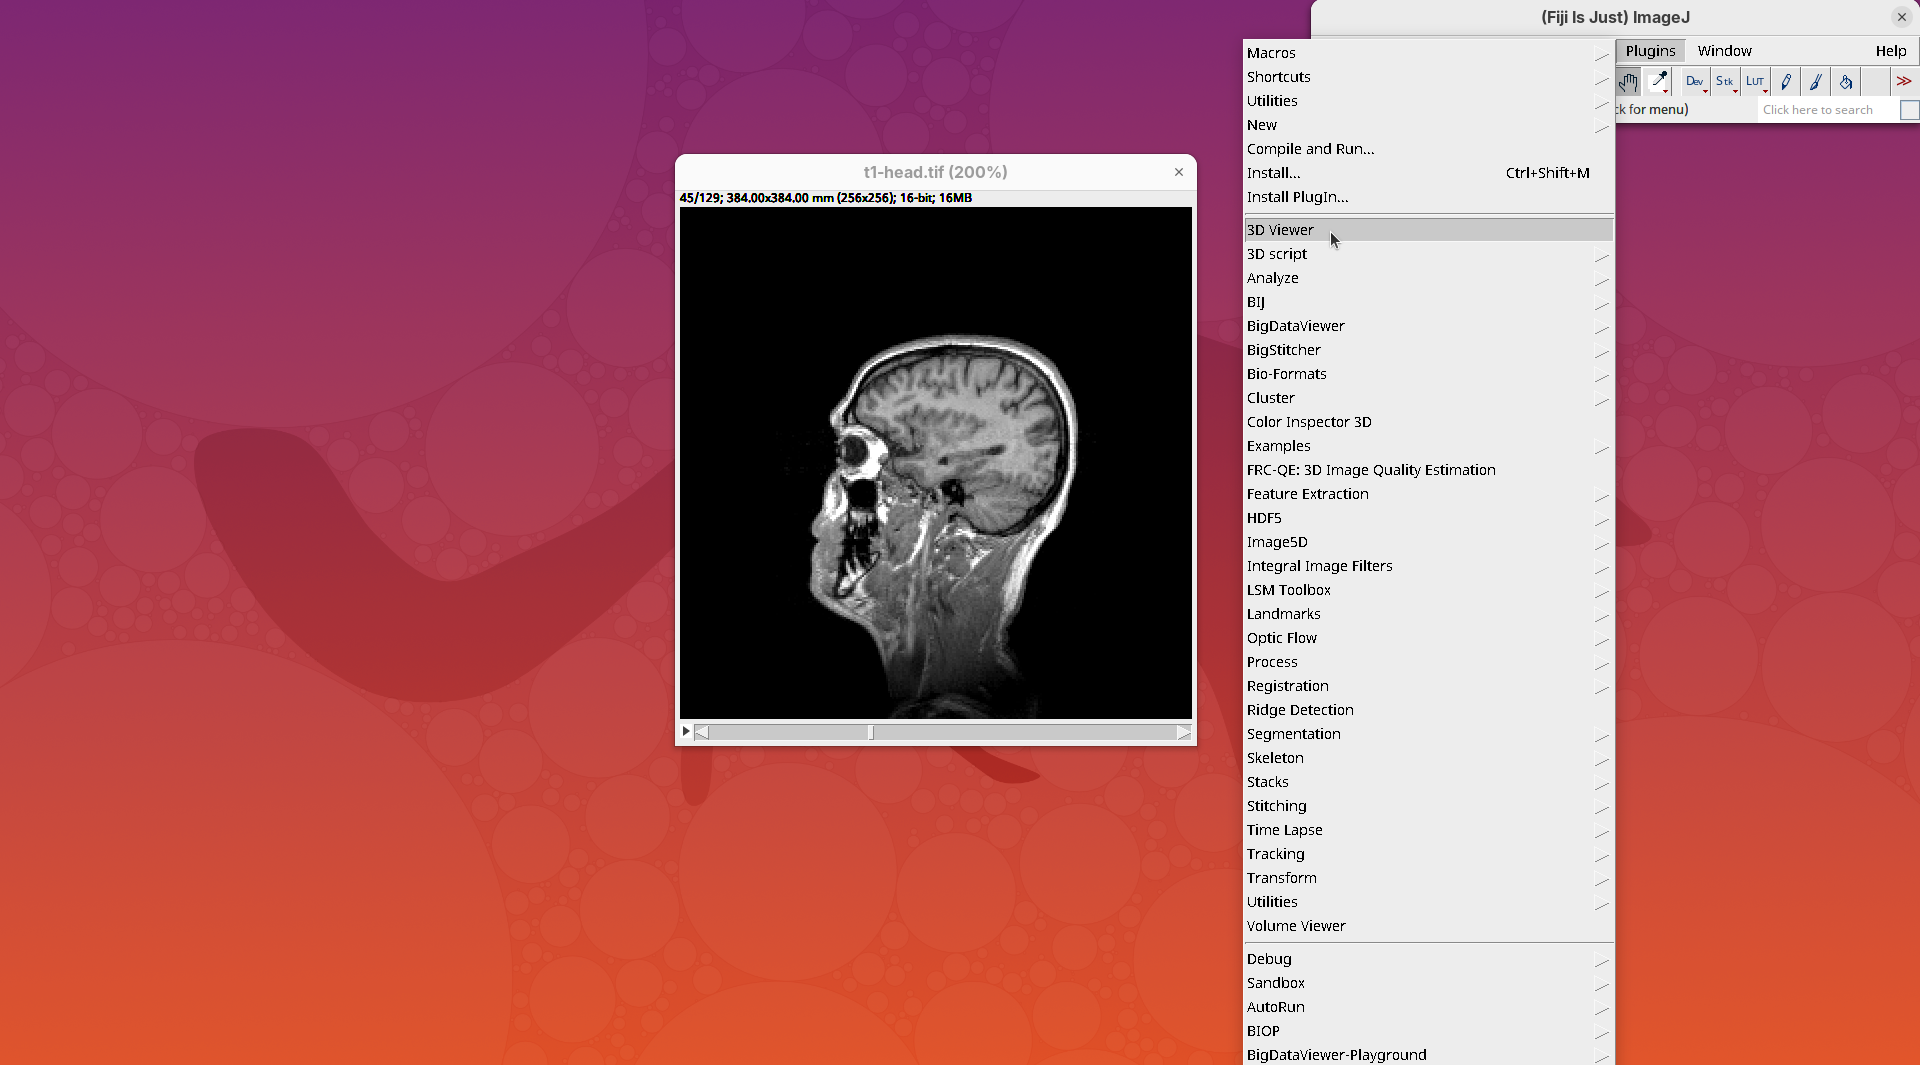
An import dialog will open. In addition to the image field itself, pay attention to the Resampling factor parameter. The default is 2, which means 2x downsampling of the original stack. Always downsample at least 2x because 3D Viewer will crash when trying to open large datasets.
- Click
OKon the options dialog and when asked about converting to 8-bit.
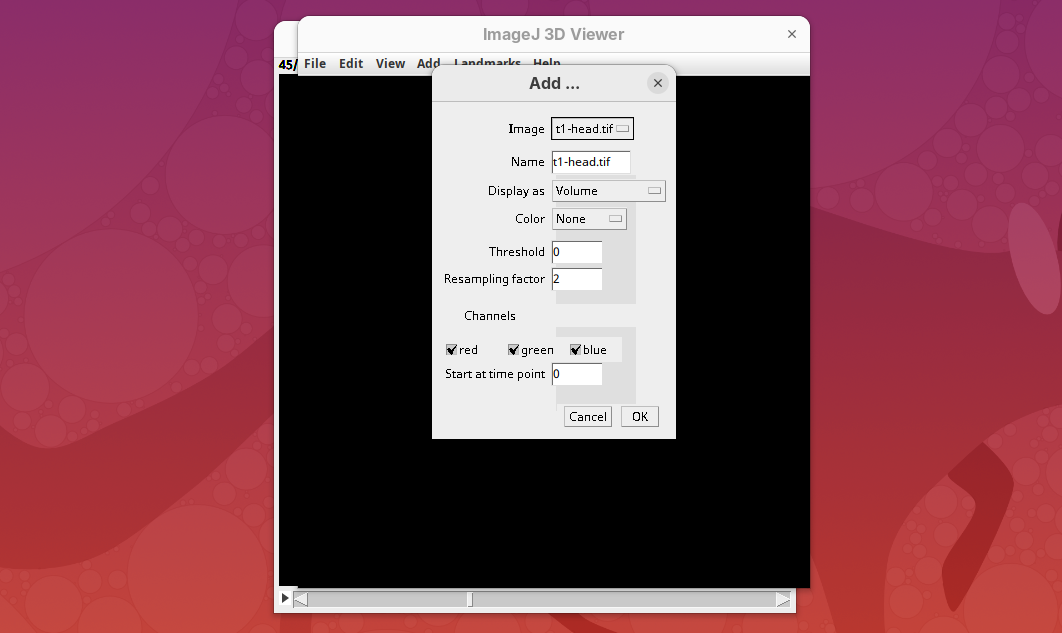
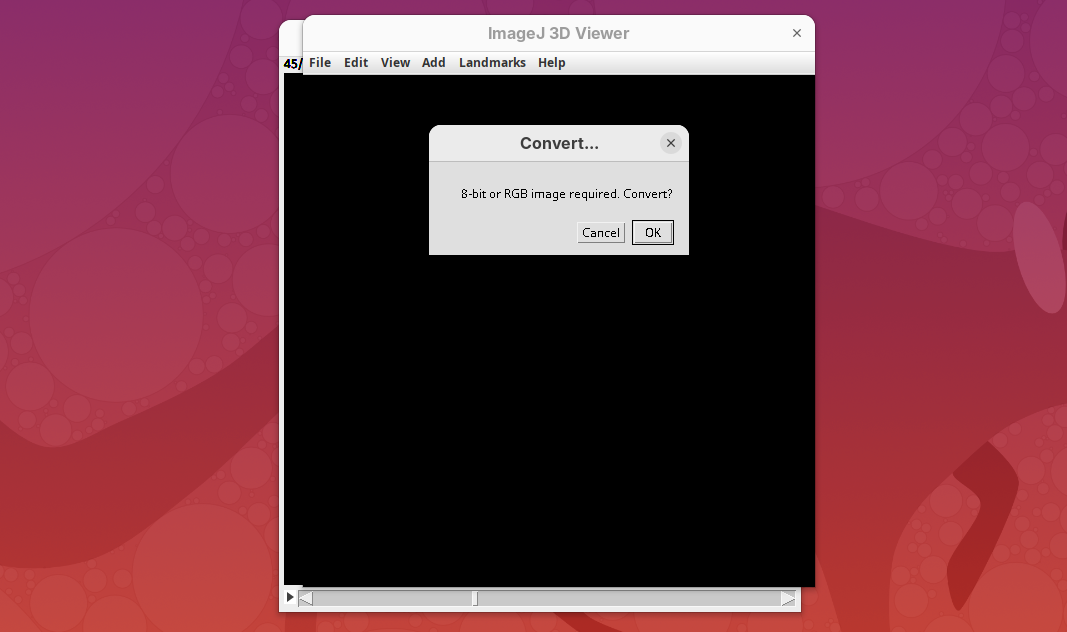
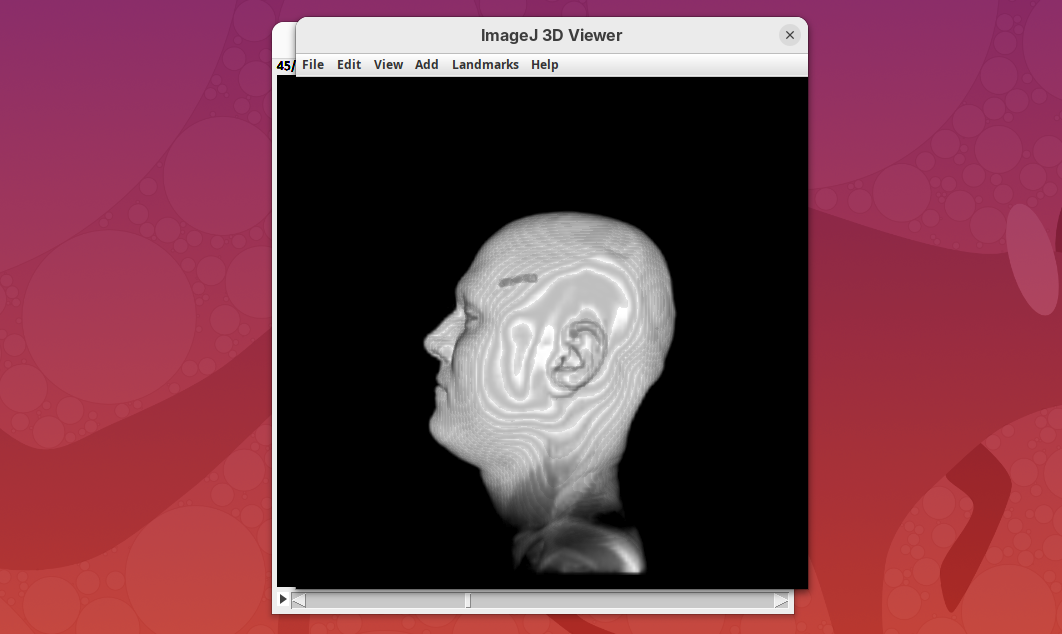
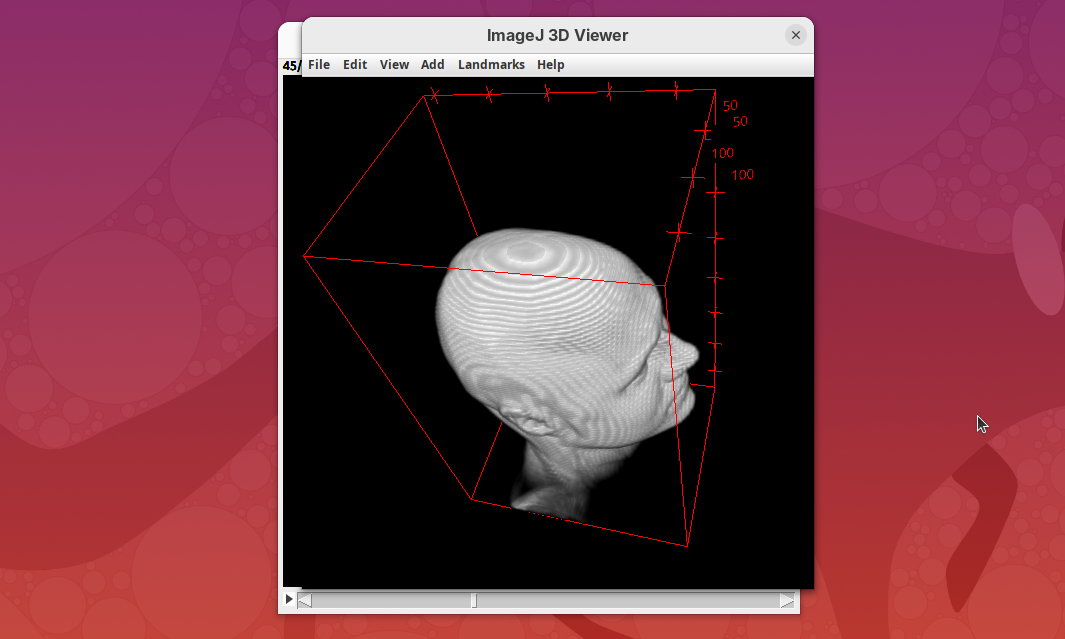
The main interface will open.
- Explore the sample interactively.
BigVolumeBrowser
BigVolumeBrowser is a Fiji plugin to render and interact with 3D data. It’s a fork of the unreleased BigVolumeViewer (a BigDataViewer cousin). The project is being actively developed and seems to have good documentation already. It’s a good candidate for some testing and for keeping an eye on in the future. However, we’ll not cover it in this tutorial as it’s simply too recent.
3Dscript
3Dscript is a GPU-accelerated Fiji plugin to generate animations of 3D/4D data (Schmid et al. 2019). It supports stacks with multiple channels and timepoints, has several options to control the rendering appearance, allows custom transformations and cropping of the data, and generates animations using a natural language, which is great to have precise control over the animation. 3Dscript is also incredibly fast to generate the animations and doesn’t require a lot of memory since the datasets can be opened as virtual stacks (more about this below).
This tutorial covers the basics for generating animations for 3D and 4D datasets. For more detailed information and documentation please refer to 3Dscript’s wiki.
To get started, make sure the head dataset is still open.
- Go to
Plugins>3Dscript>Interactive Animation.
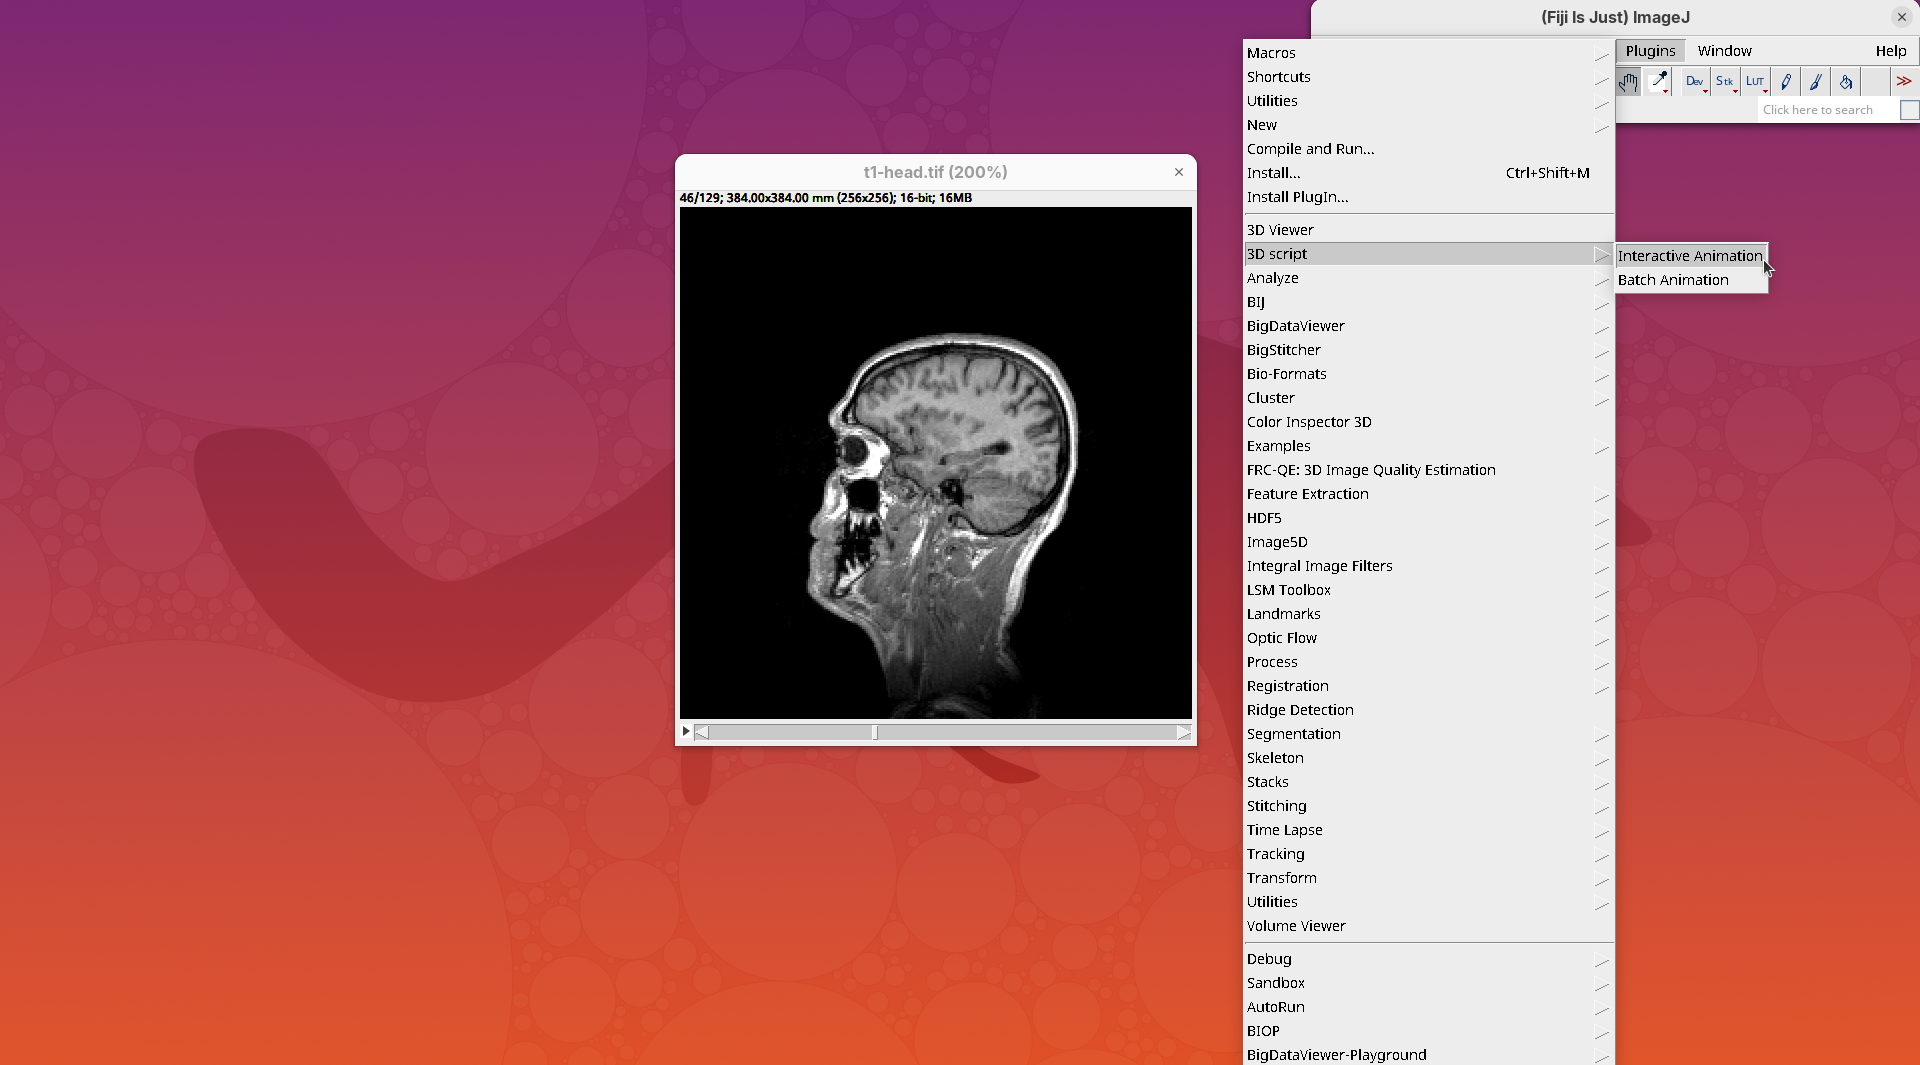
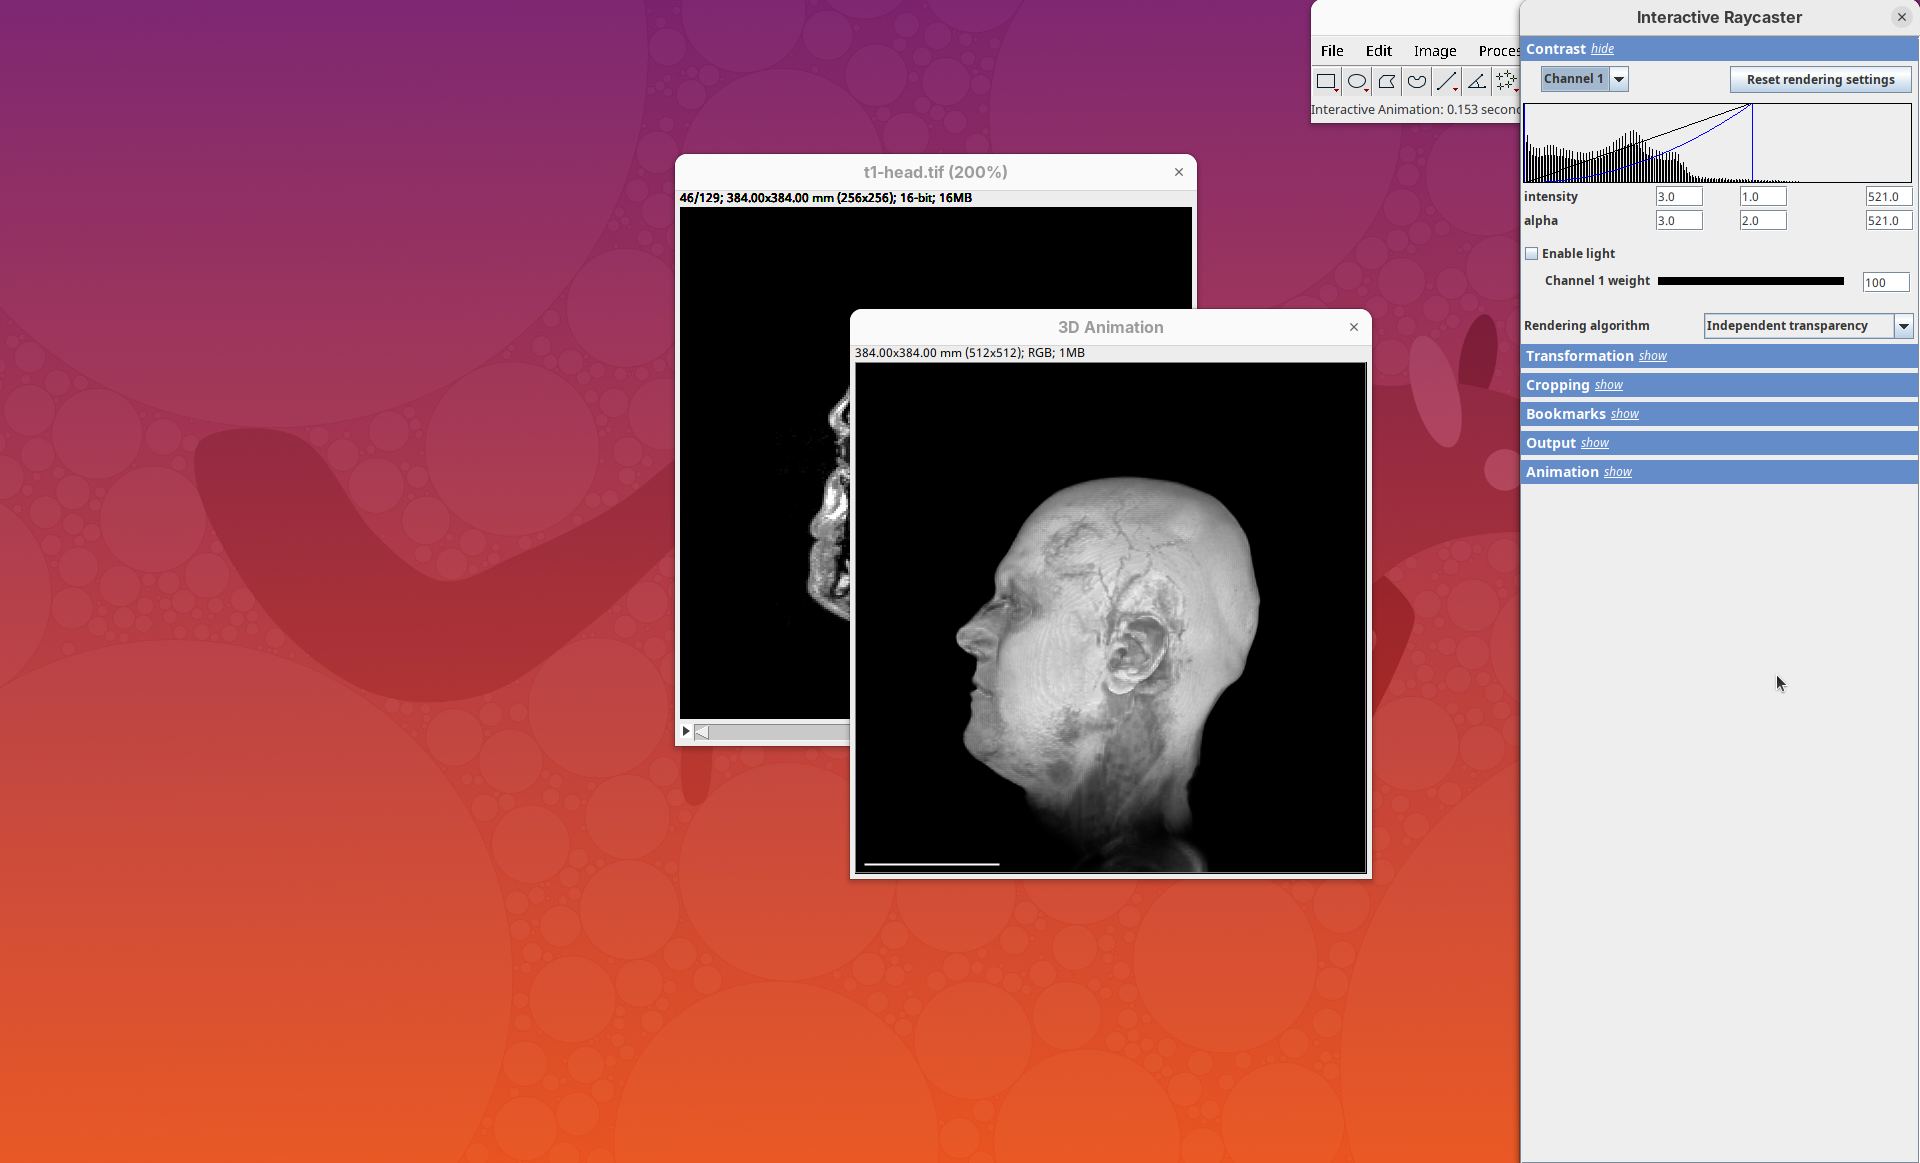
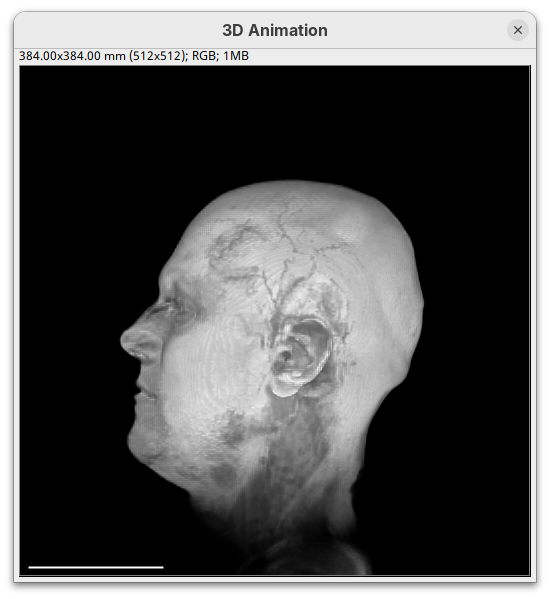
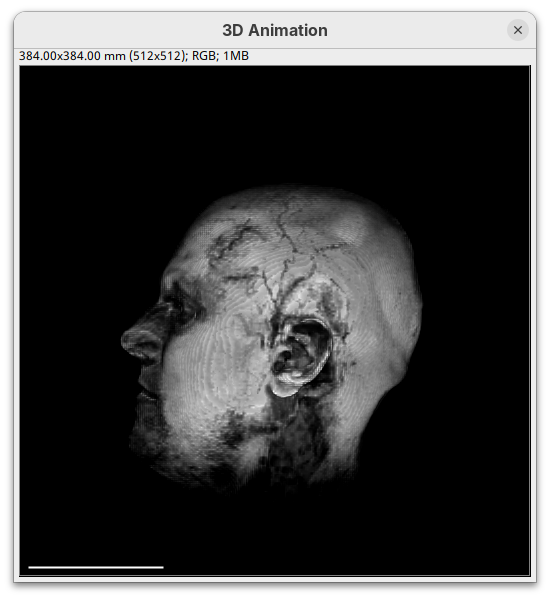
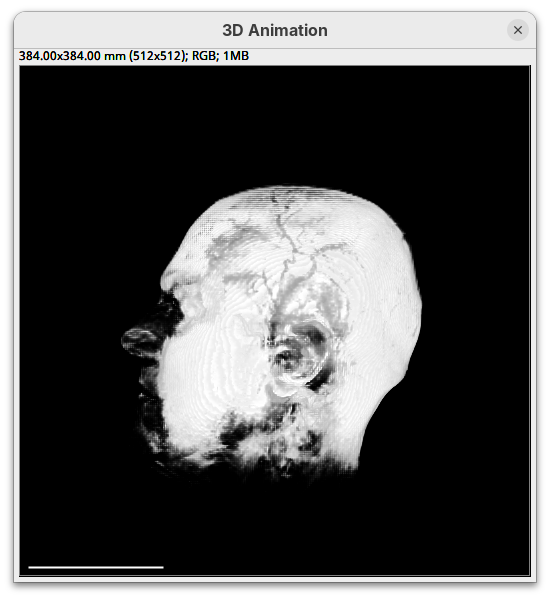
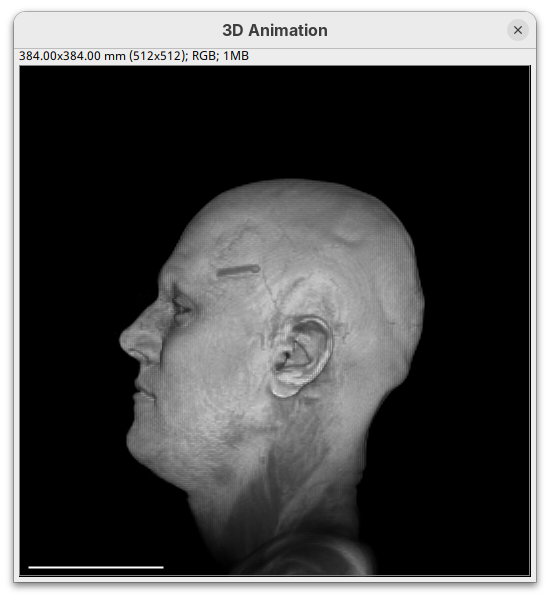
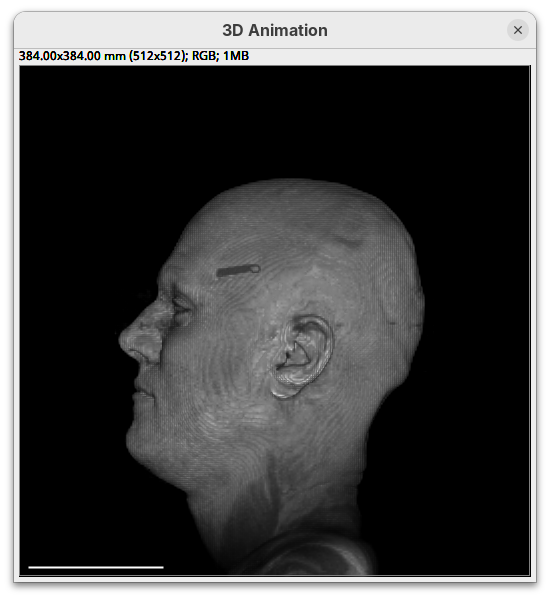
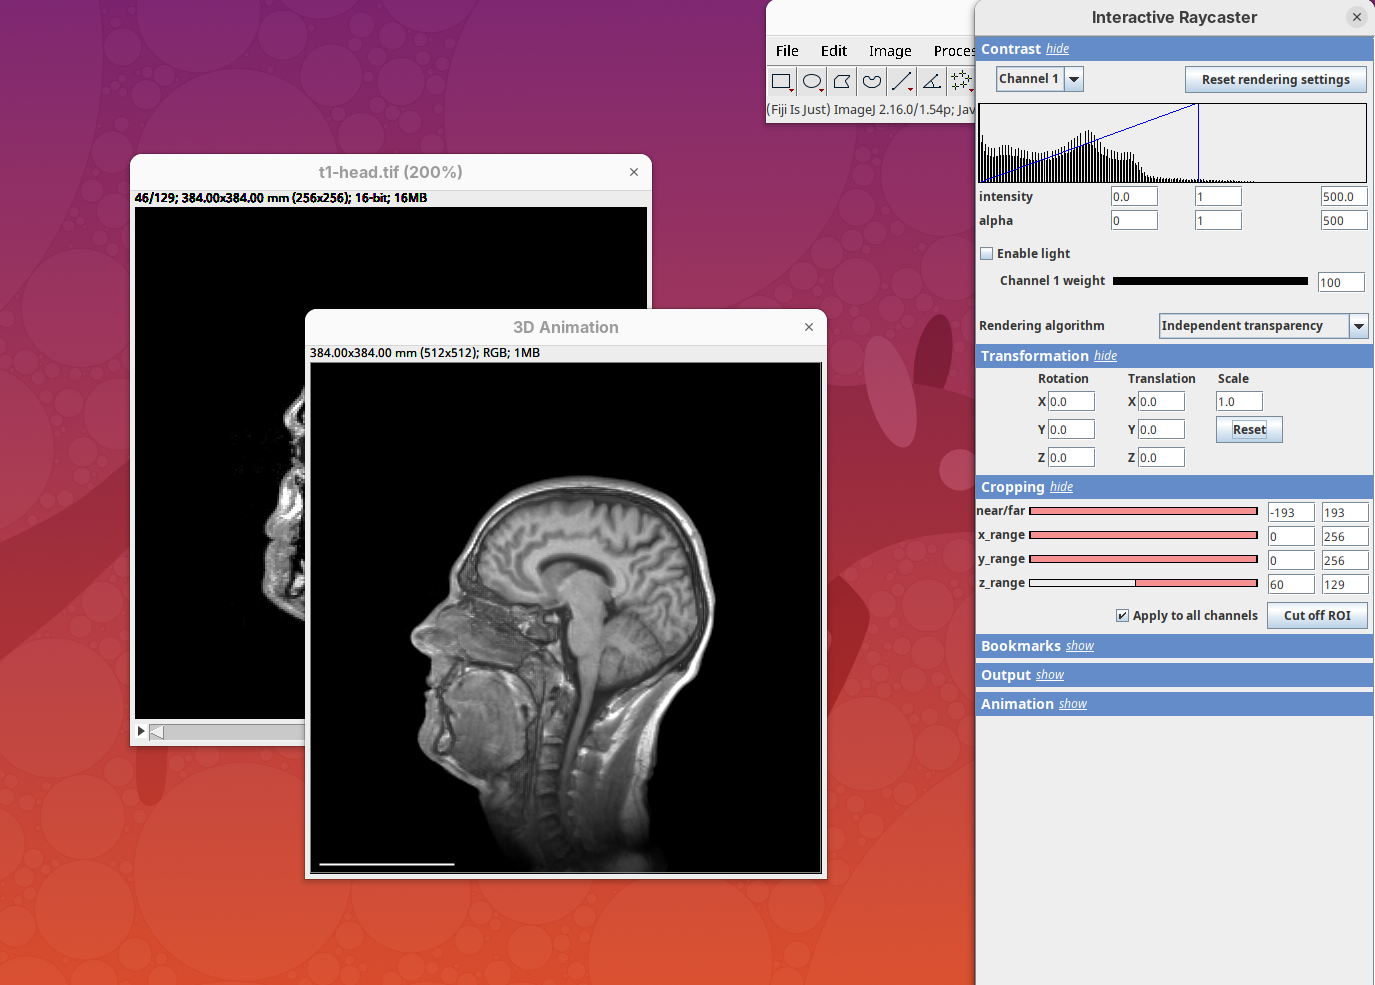
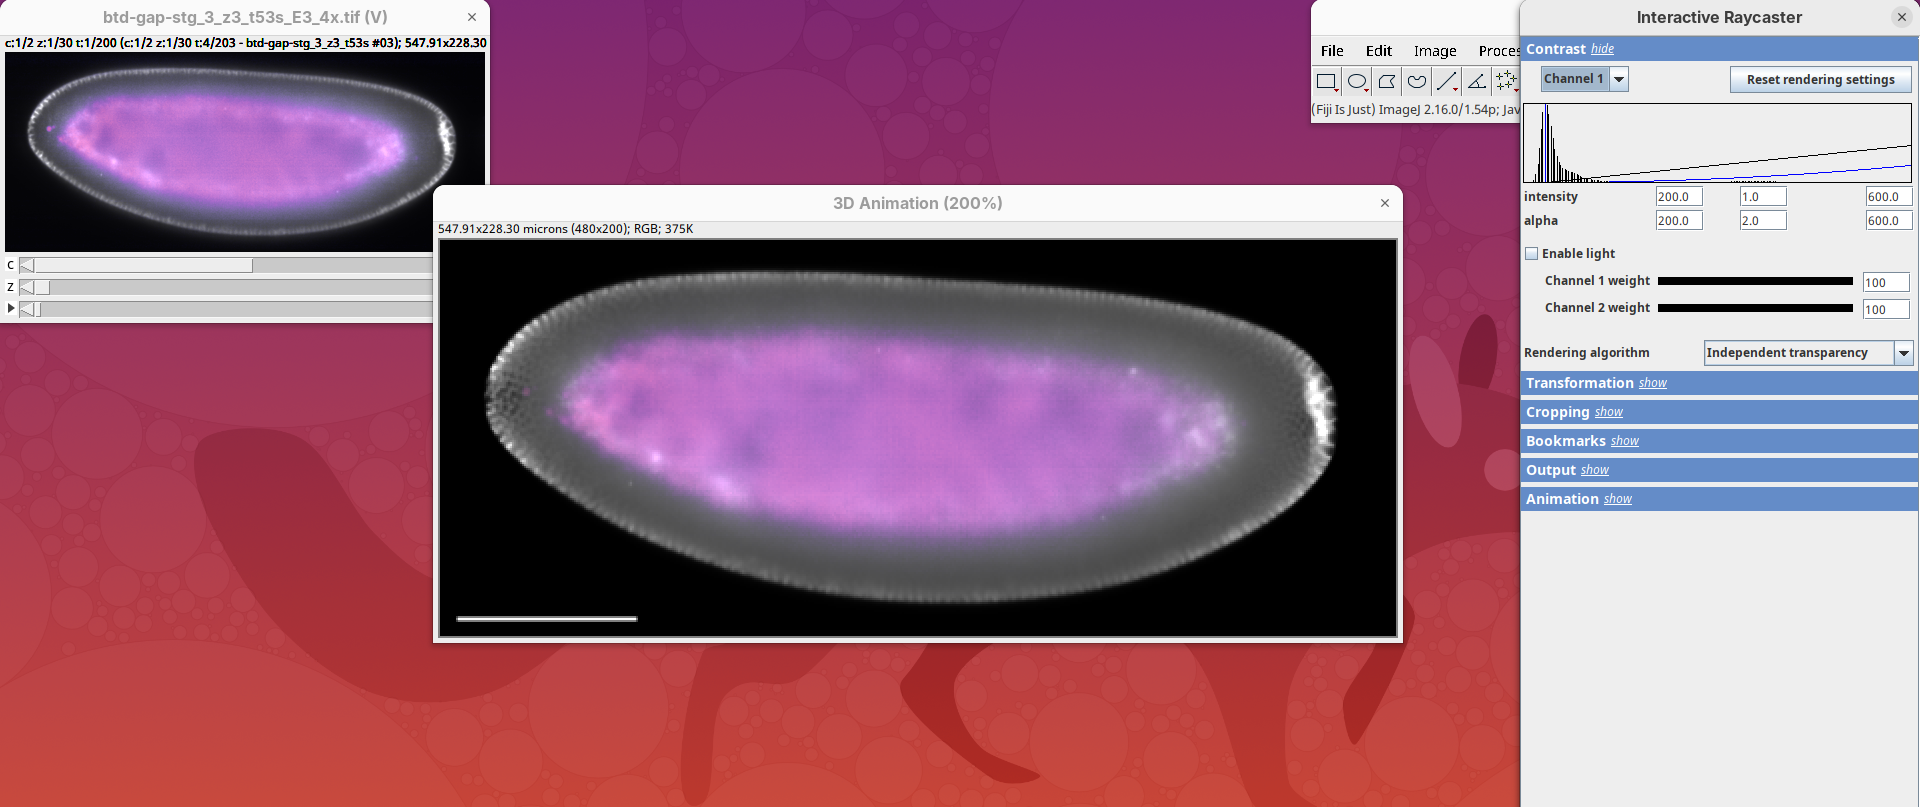
Two new windows will open: 3D Animation with the initial rendering of the data and Interactive Raycaster with all the fields to control the rendering parameters.
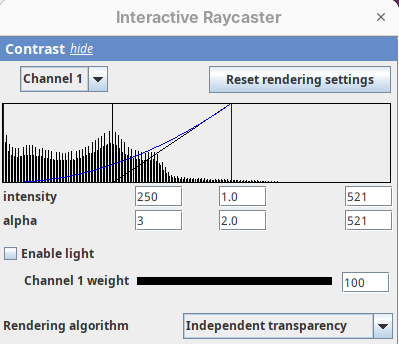
Contrast
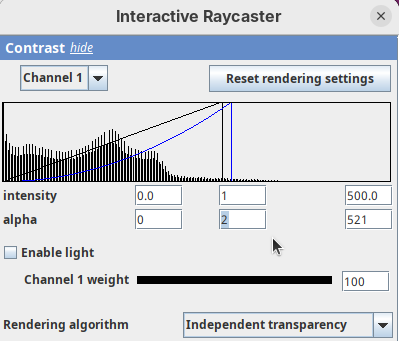
The Contrast section shows a histogram of pixel intensities of the image for each channel, which we can choose using the dropdown menu. We can set the minimum, gamma, and maximum values for the intensity and alpha (transparency) properties of each pixel. The weight option controls the general opacity of the channel (0=invisible, 100=visible). There’s also more advanced options like lighting and rendering algorithm which we’ll simply use the default states as they are usually good for most use cases.
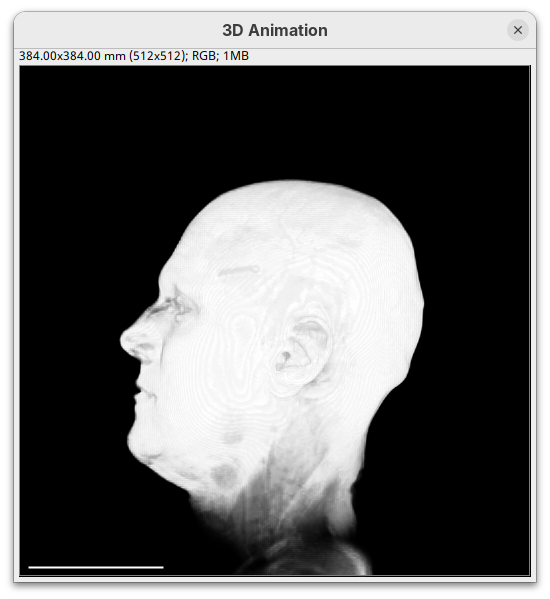
Adjusting the intensity and alpha values is the most impactful way to improve the 3D rendering. With the intensity setting we can define which pixel value in the image corresponds to total black (minimum) and which corresponds to total white. It’s the same as in the standard Brightness & Contrast tool. By default, 3Dscript will load these values from the original stack. In this case, it loaded min=3 and max=521.

Let’s change these values to see how it impacts the 3D rendering.
- Change the intensity minimum to
250.
You will see that the darkest parts of the rendering will become even darker and no longer visible. We are losing real information from the data; we do not want that.
- Set the
minto0, for now. - Then, change the
maxto250.
The brightest parts of the rendering will become all white. It is so bright that we can no longer resolve details of the surface. We are losing information and also do not want that.
- Set the
maxto500.
Note that when you change an intensity value, the min/max black line in the histogram moves. You can also grab the line and move it manually to change the values.
The blue line represents the alpha values. In 3D rendering, a pixel has a transparency value linked to its intensity. The alpha min defines the value for full transparency and the max the value for full opacity.
- Set the alpha
minto250.
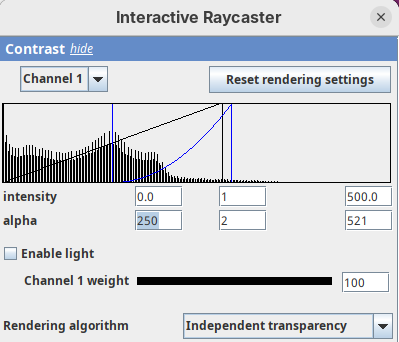
This will make darker pixels more transparent and information gets lost.
- Set it to
0.
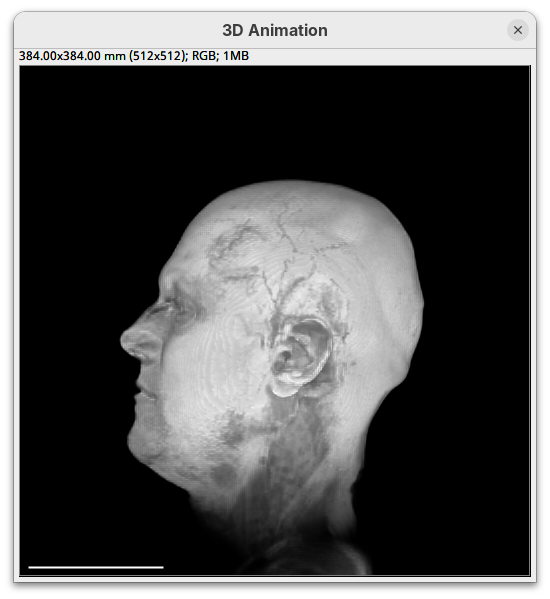
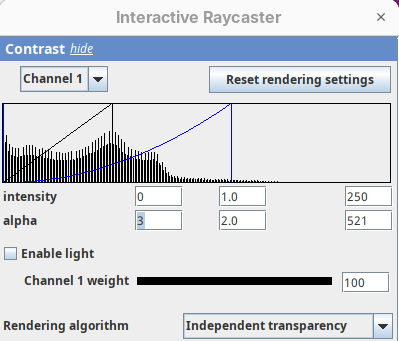
By default 3Dscript sets the gamma value of alpha to 2.0. That’s a good default for fluorescence microscopy (see the next dataset below), but since this is MRI data, we need to tweak it a little differently.
- Set the alpha gamma value to
1.0.
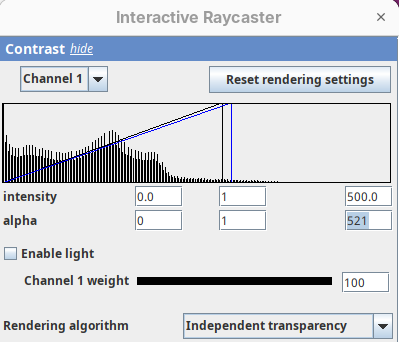
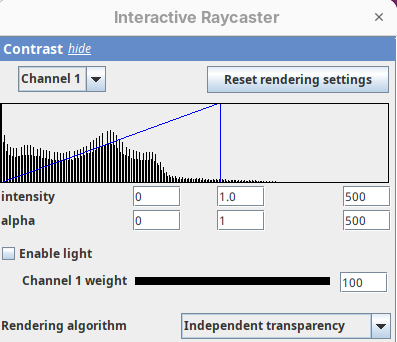
Note that this improves the visualization as the head’s surface becomes better visible.
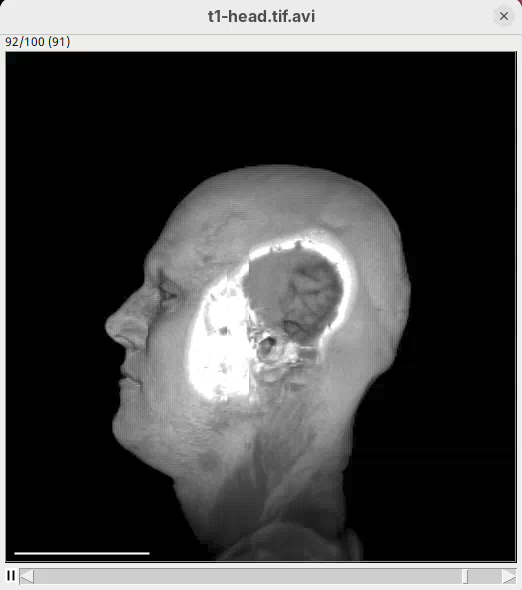
- Now set the alpha
maxto250.
The surface will become even more solid because we are defining that pixels that have a value above 250 will be fully opaque.
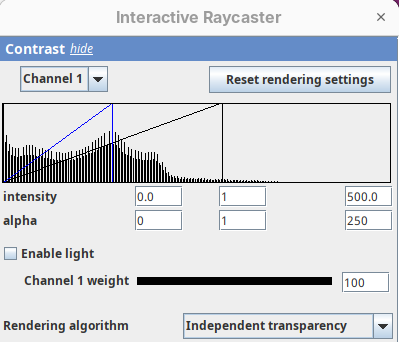
- To compare, set alpha
maxto5000.
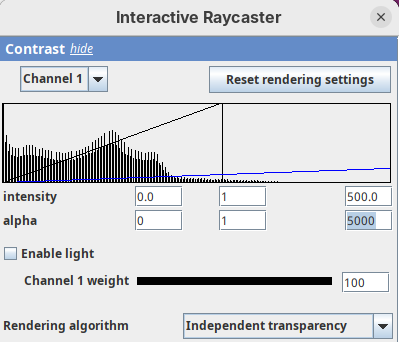
You will notice that the sample will become more transparent. Even the brain inside the skull will be visible.
- Set alpha
maxback to500.
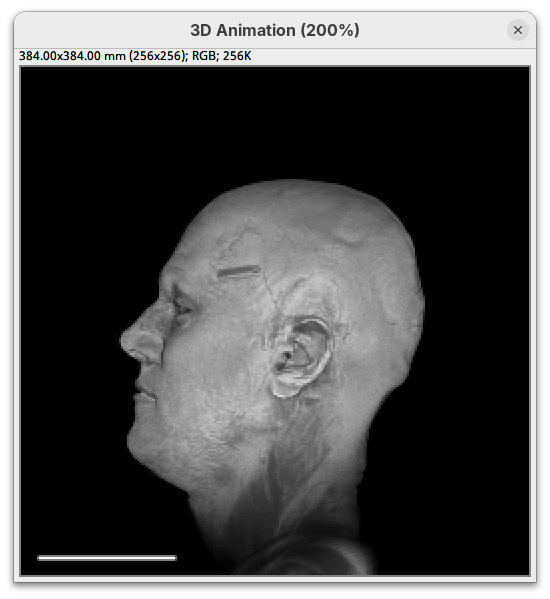
Generally, setting the intensity and alpha to the same values is a good starting point for optimizing the rendering.
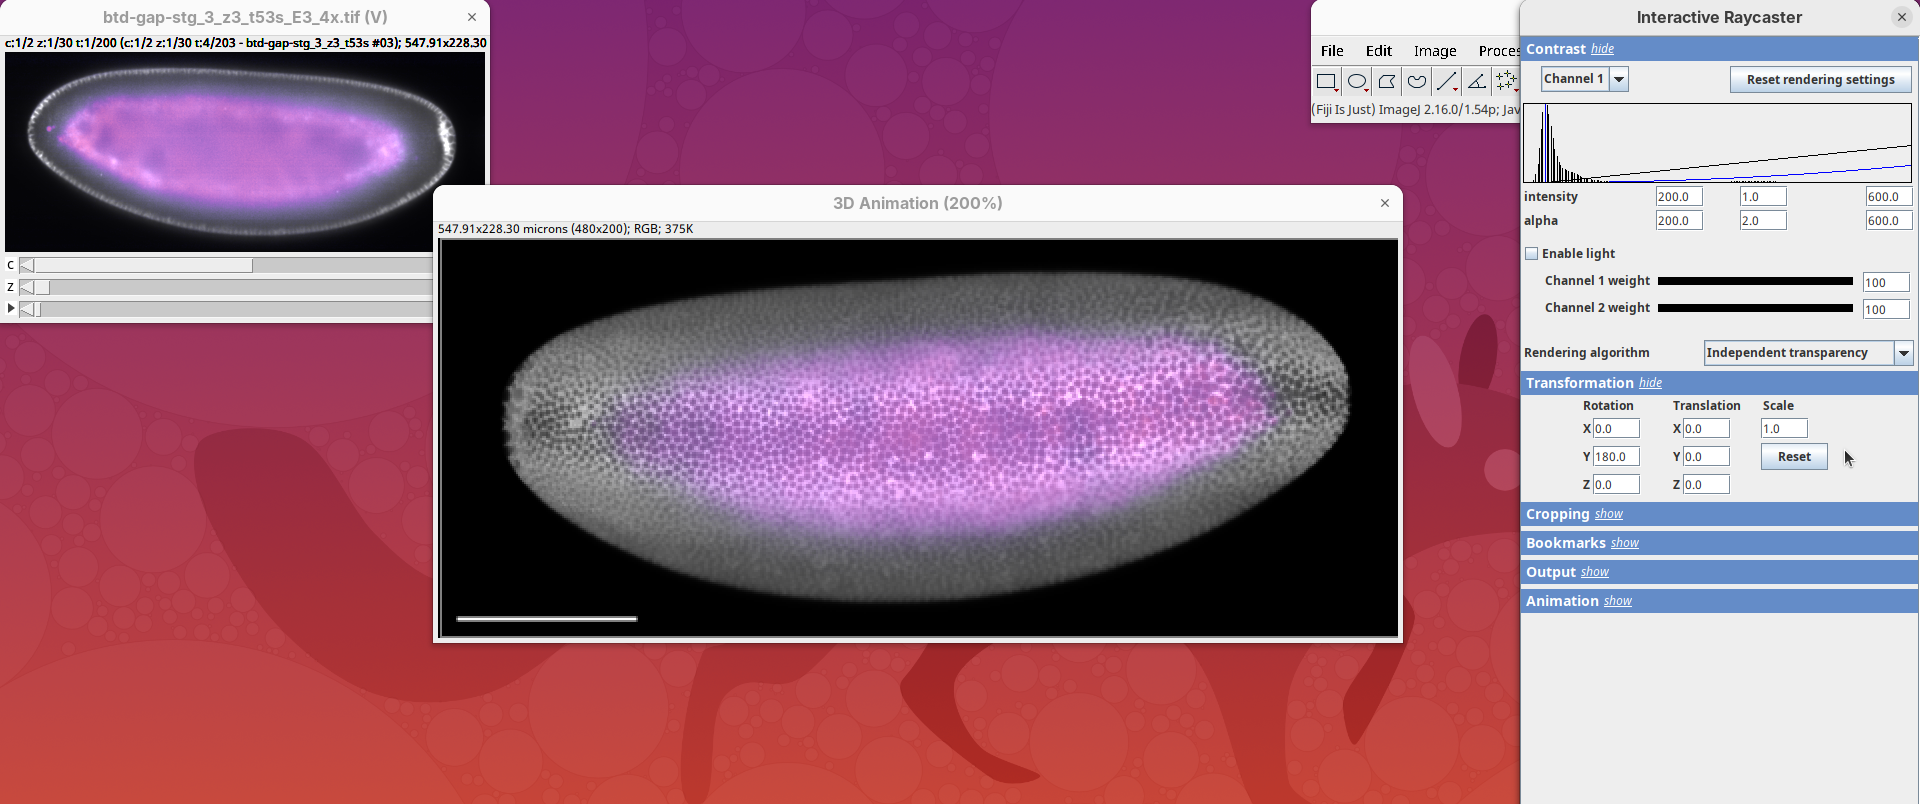
Transformation
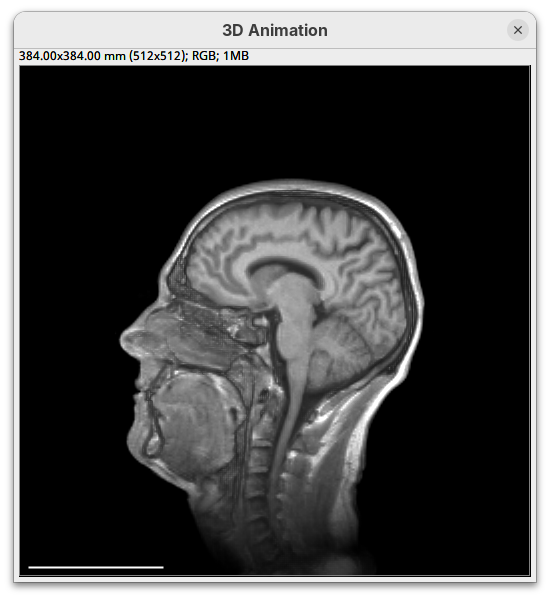
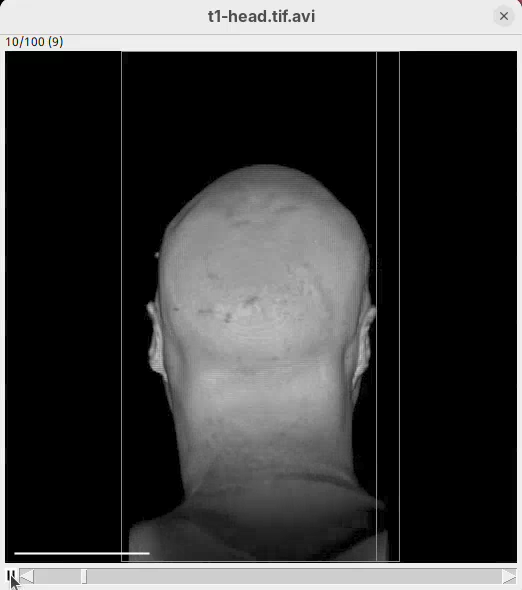
The transformation menu has controls for rotating, translating, and scaling the sample. We can either add values or manually interact with the 3D Animation window to reorient the sample. Let’s try the latter.
- Left-click on the head and move it around.
![]()
That’s a great way to see your sample from different angles. And note that the values in the Transformation panel get updated every time you move the sample interactively. In this way you can roughly position the sample and then check and update the precise values for the target transformation.
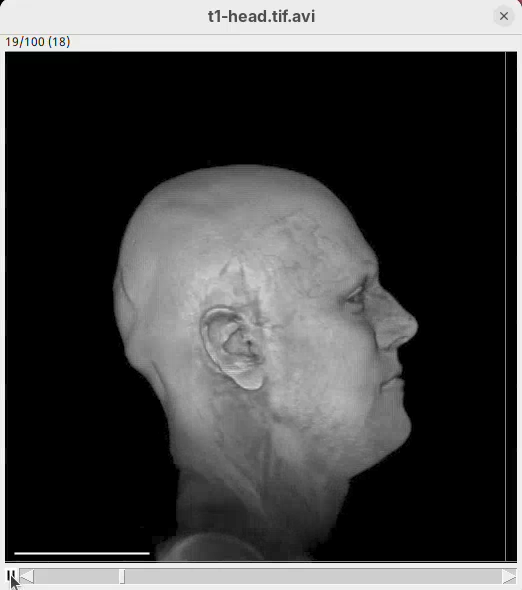
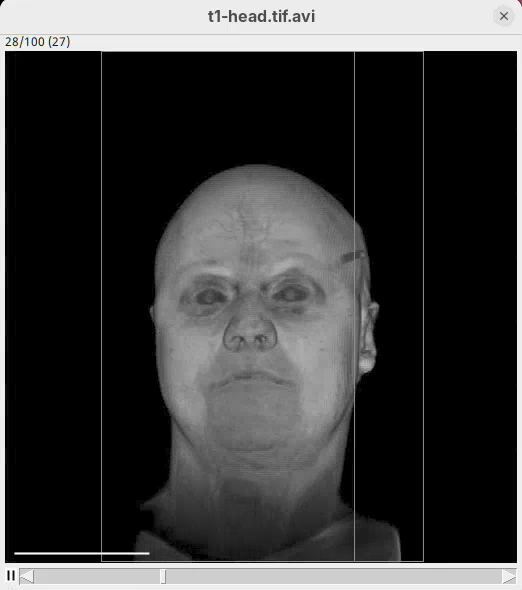
- Press
Resetand change theRotation Yto180to look at the right side of the head.
![]()
![]()
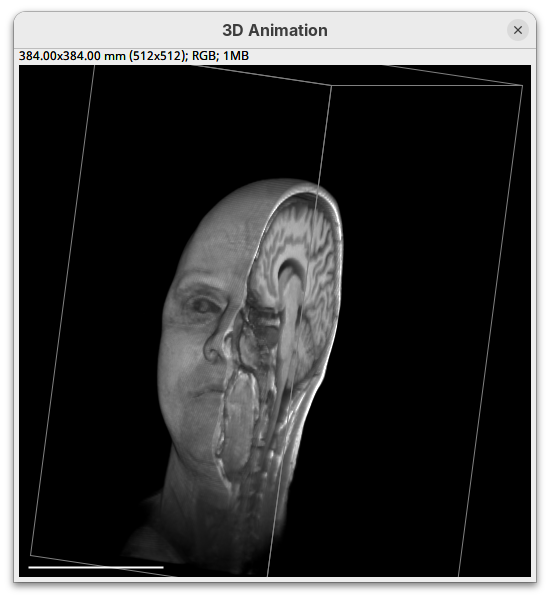
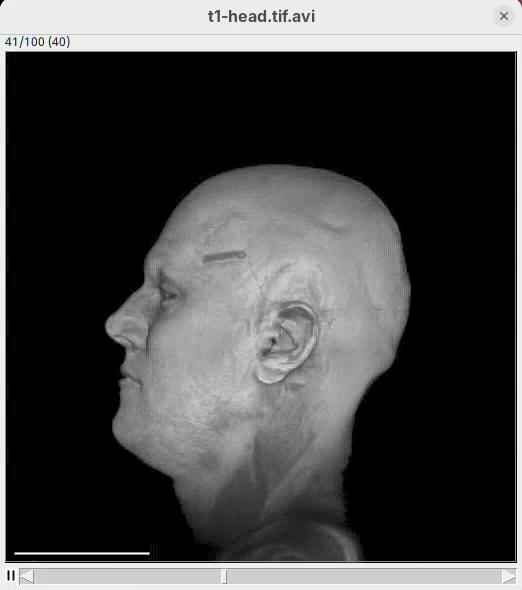
- Now change
Scaleto5andTranslation Xto-500to focus on the nose.
![]()
![]()
- Press
Resetto return the sample to its original position.
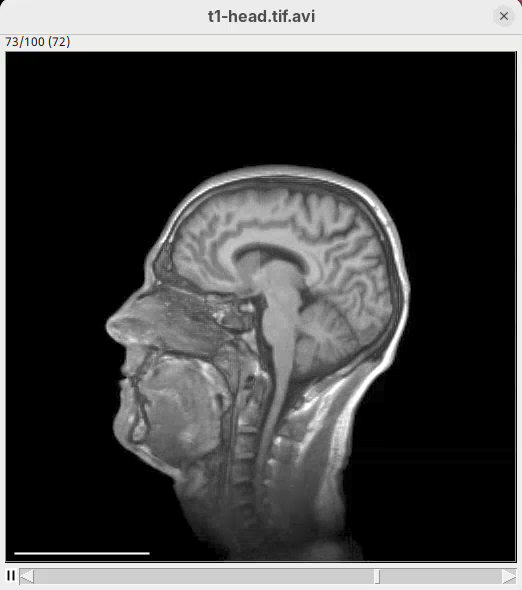
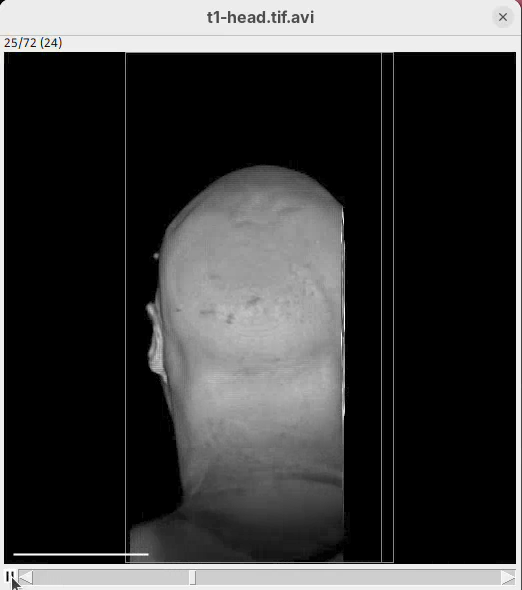
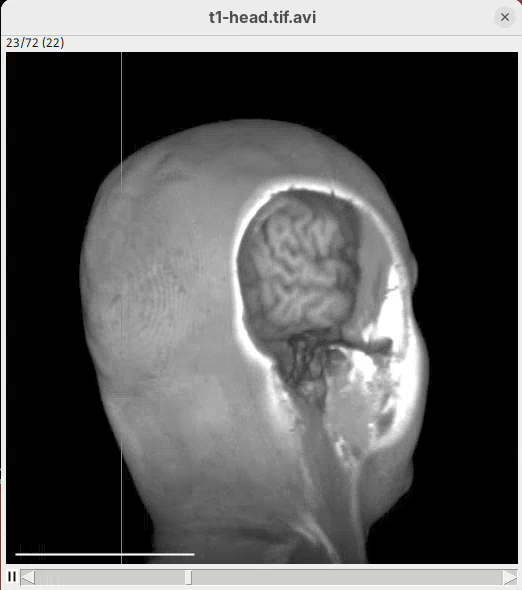
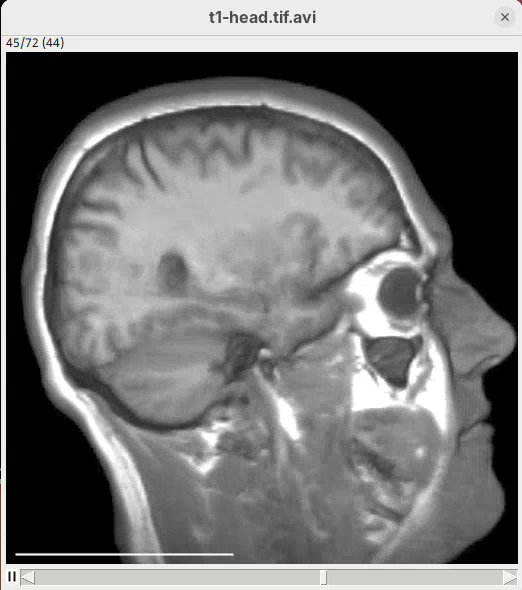
Cropping
Another useful 3Dscript option is the ability to crop the bounding box to show the inside of the sample. We can do it in the XYZ directions or in the near/far axis, defined from the user point of view.
- Set the Z range minimum value to
60(you can also drag the slider) to slice the sample through the Z axis.
- Now rotate the sample to see the cropped region from other angles.
- Set the Y range
minto125and rotate around.
![]()
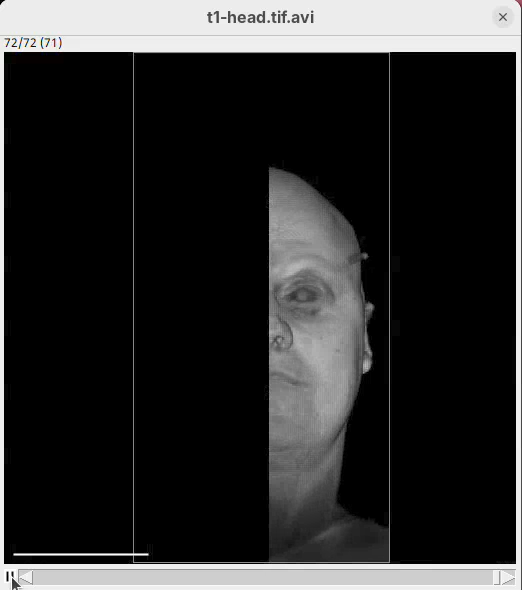
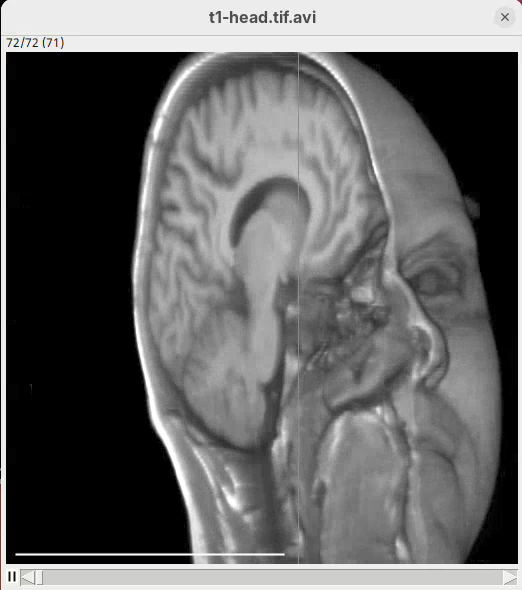
- Finally, reset the position and cropping parameters and set the Near/Far minimum to
0and move the sample around to see the dynamic reslice of the sample with this cropping parameter.
![]()
- Reset transformations and cropping parameters.
Bookmark
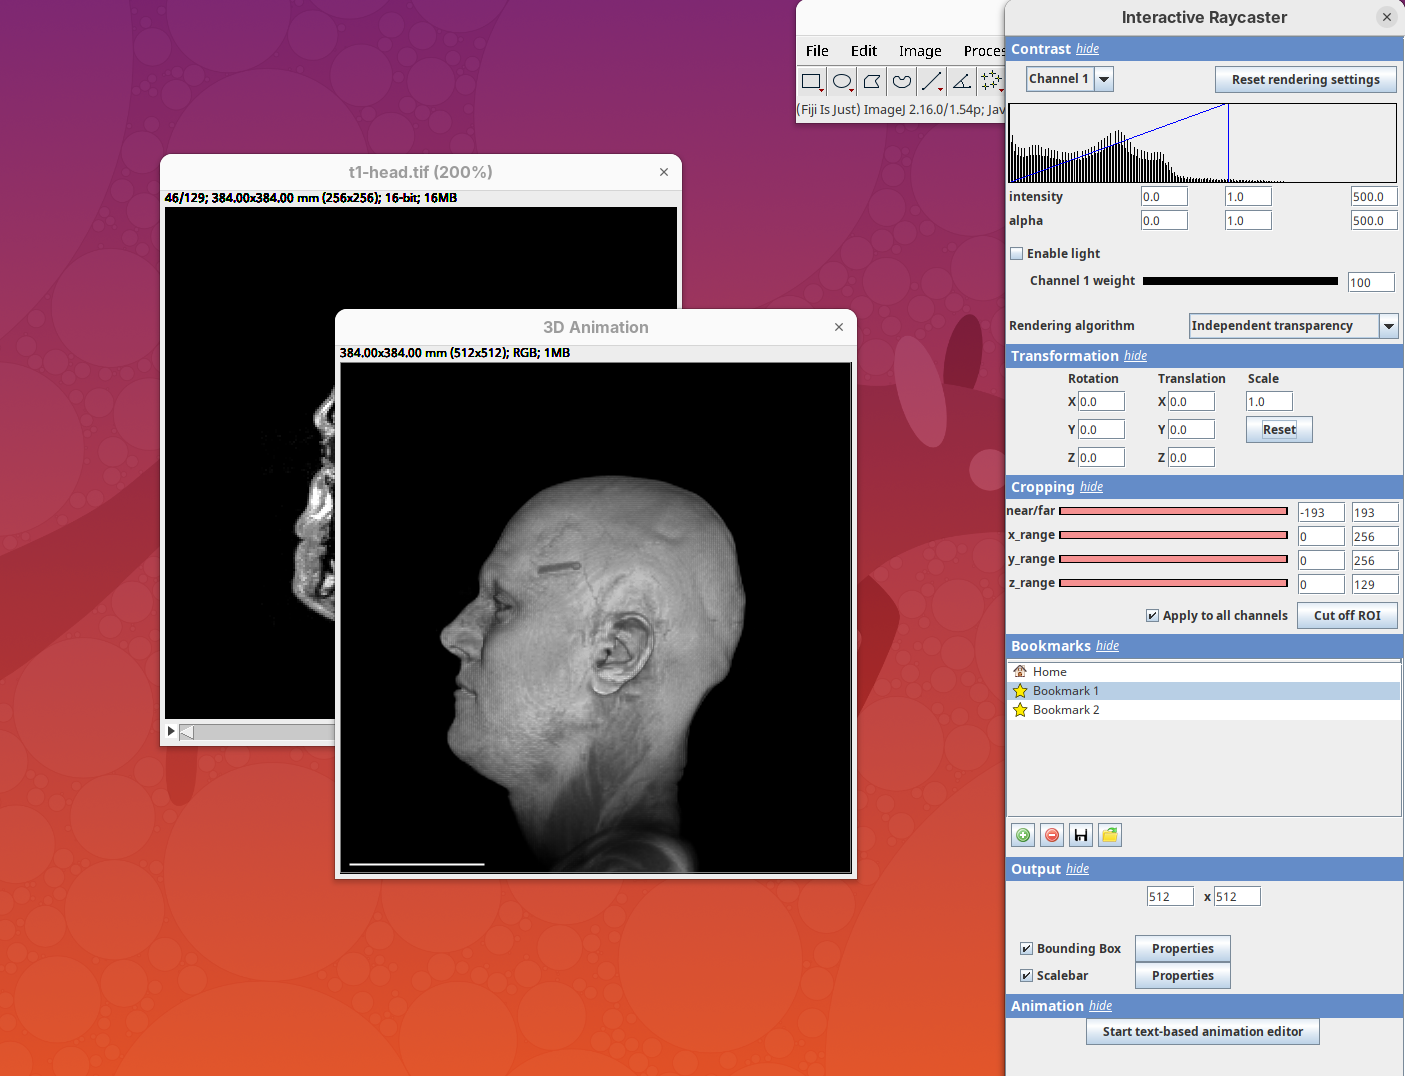
3Dscript allows you to bookmark a view for later inspection. Add the current Contrast, Transformation, and Cropping parameters to the bookmark.
- For that, simply click on the green icon.
![]()
Output
This last panel defines the dimensions of the output animation. By default it uses the original stack dimensions.
![]()
You can also define if the bounding box or the scale bar will be visible (enabled by default).
Animation 3D
Now that we learned the basics of setting up the rendering and view parameters, we can start generating animations of the data.
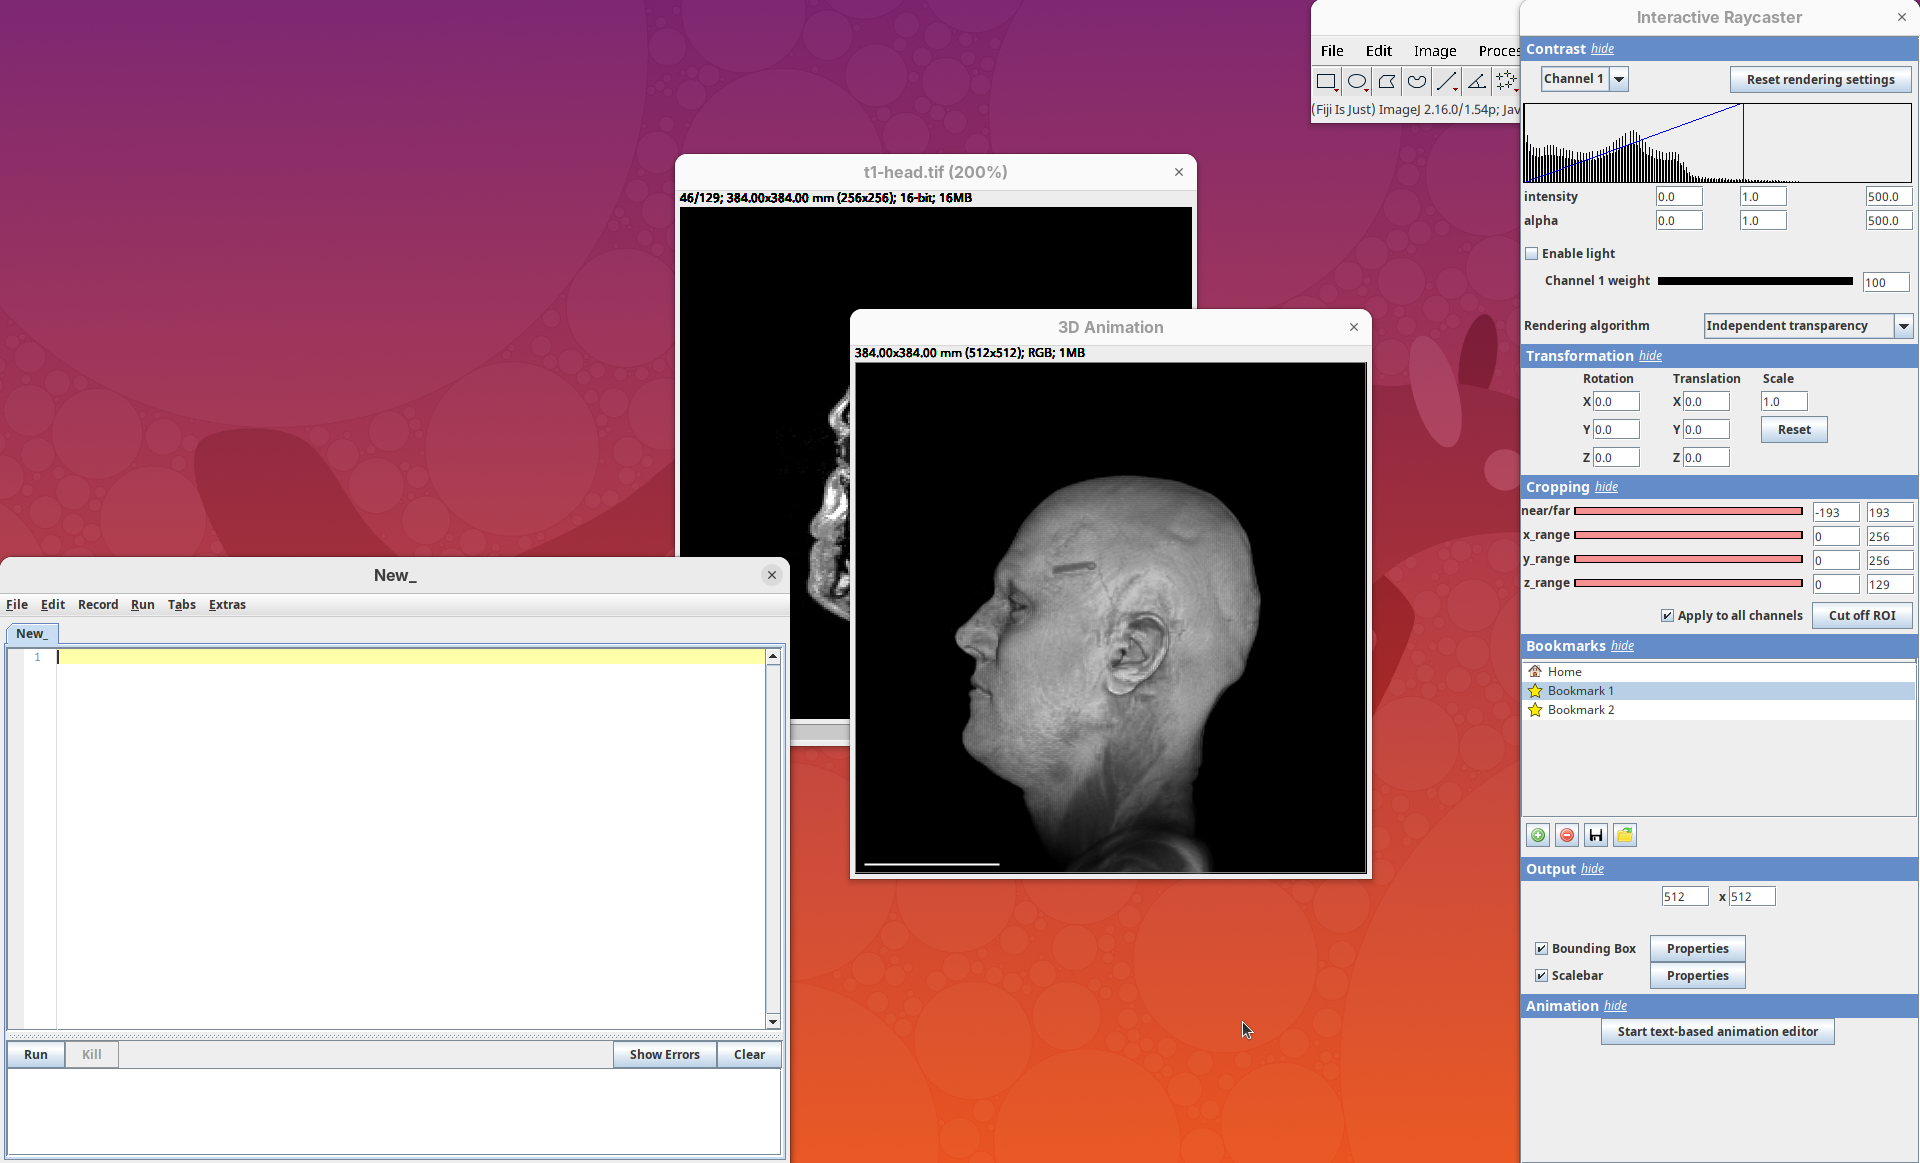
- Click on the
Animationsection and on theStart text-based animation editorbutton.
This will open a special editor window for writing the animation script.
Rotate horizontally
Let’s start with the simplest animation: a rotation of the head around 360 degrees. We need to define the number of frames that the animation will have and what will happen during these frames. We can start by defining that the animation will have ten frames.
Note: frame counting in 3Dscript begins from 0 (frame 0 to 9 has 10 frames).
The editor has a strong autocomplete; you only need to type one letter at a time to be able to write the exact text needed for the animation.
- Type
f. The editor will autocomplete withFrom frame <frame>. - Type
0and space. The autocomplete will fill withFrom frame 0 to frame <frame>. - Type
9and space. The autocomplete will show a dropdown menu with several options (rotate by,translate,zoom by a factor of,reset transformation, andchange). - Choose
rotate byand pressTab. The autocomplete will showFrom frame 0 to frame 9 rotate by <degrees>. - Type
360and space. The sentence will beFrom frame 0 to frame 9 rotate by 360 degreesand a dropdown will show the optionshorizontally,vertically, andaround. - Choose
horizontallyand on the next menu choose(none).
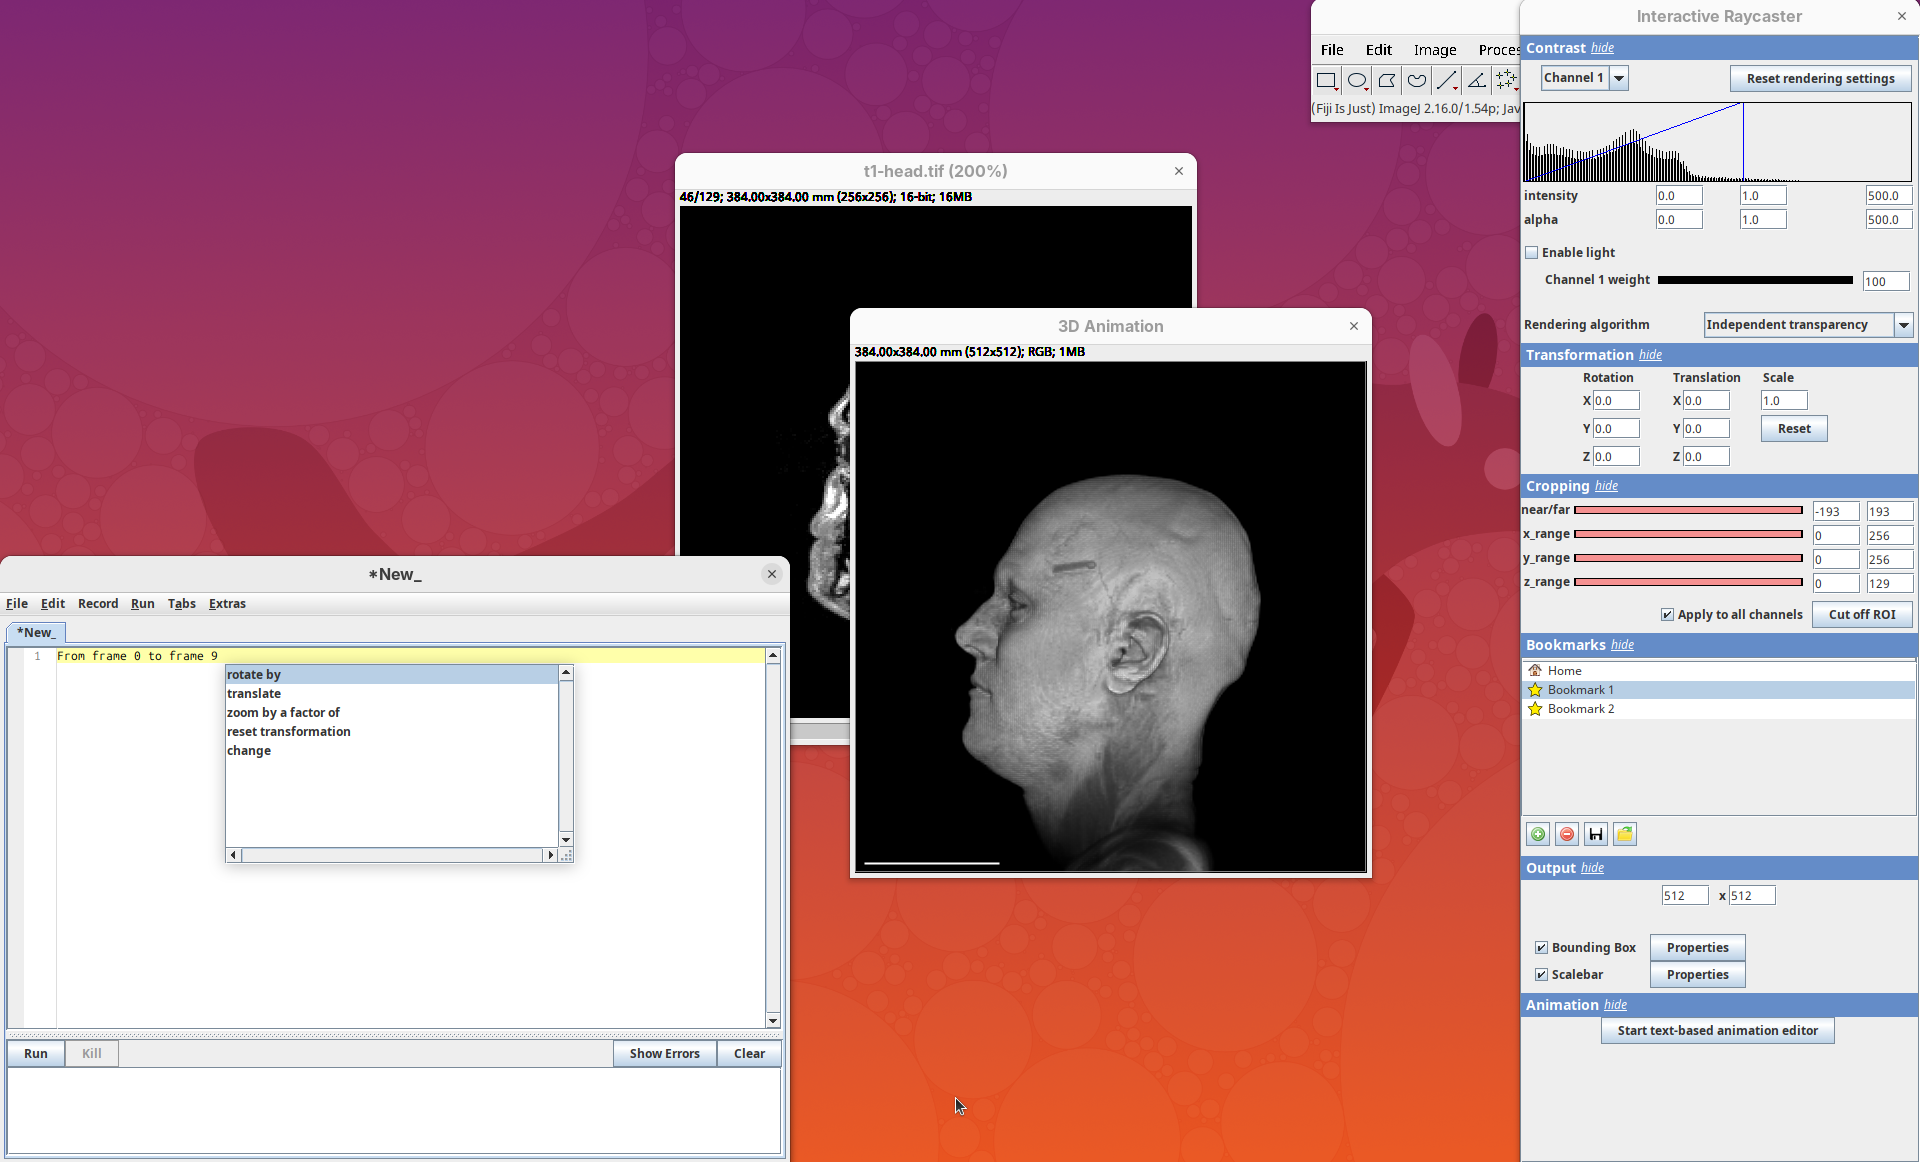

We have our first animation script and it’s just this single sentence:
From frame 0 to frame 9 rotate by 360 degrees horizontally- Press
Run.
A new window will show up with an image stack of 10 frames containing the generated animation.
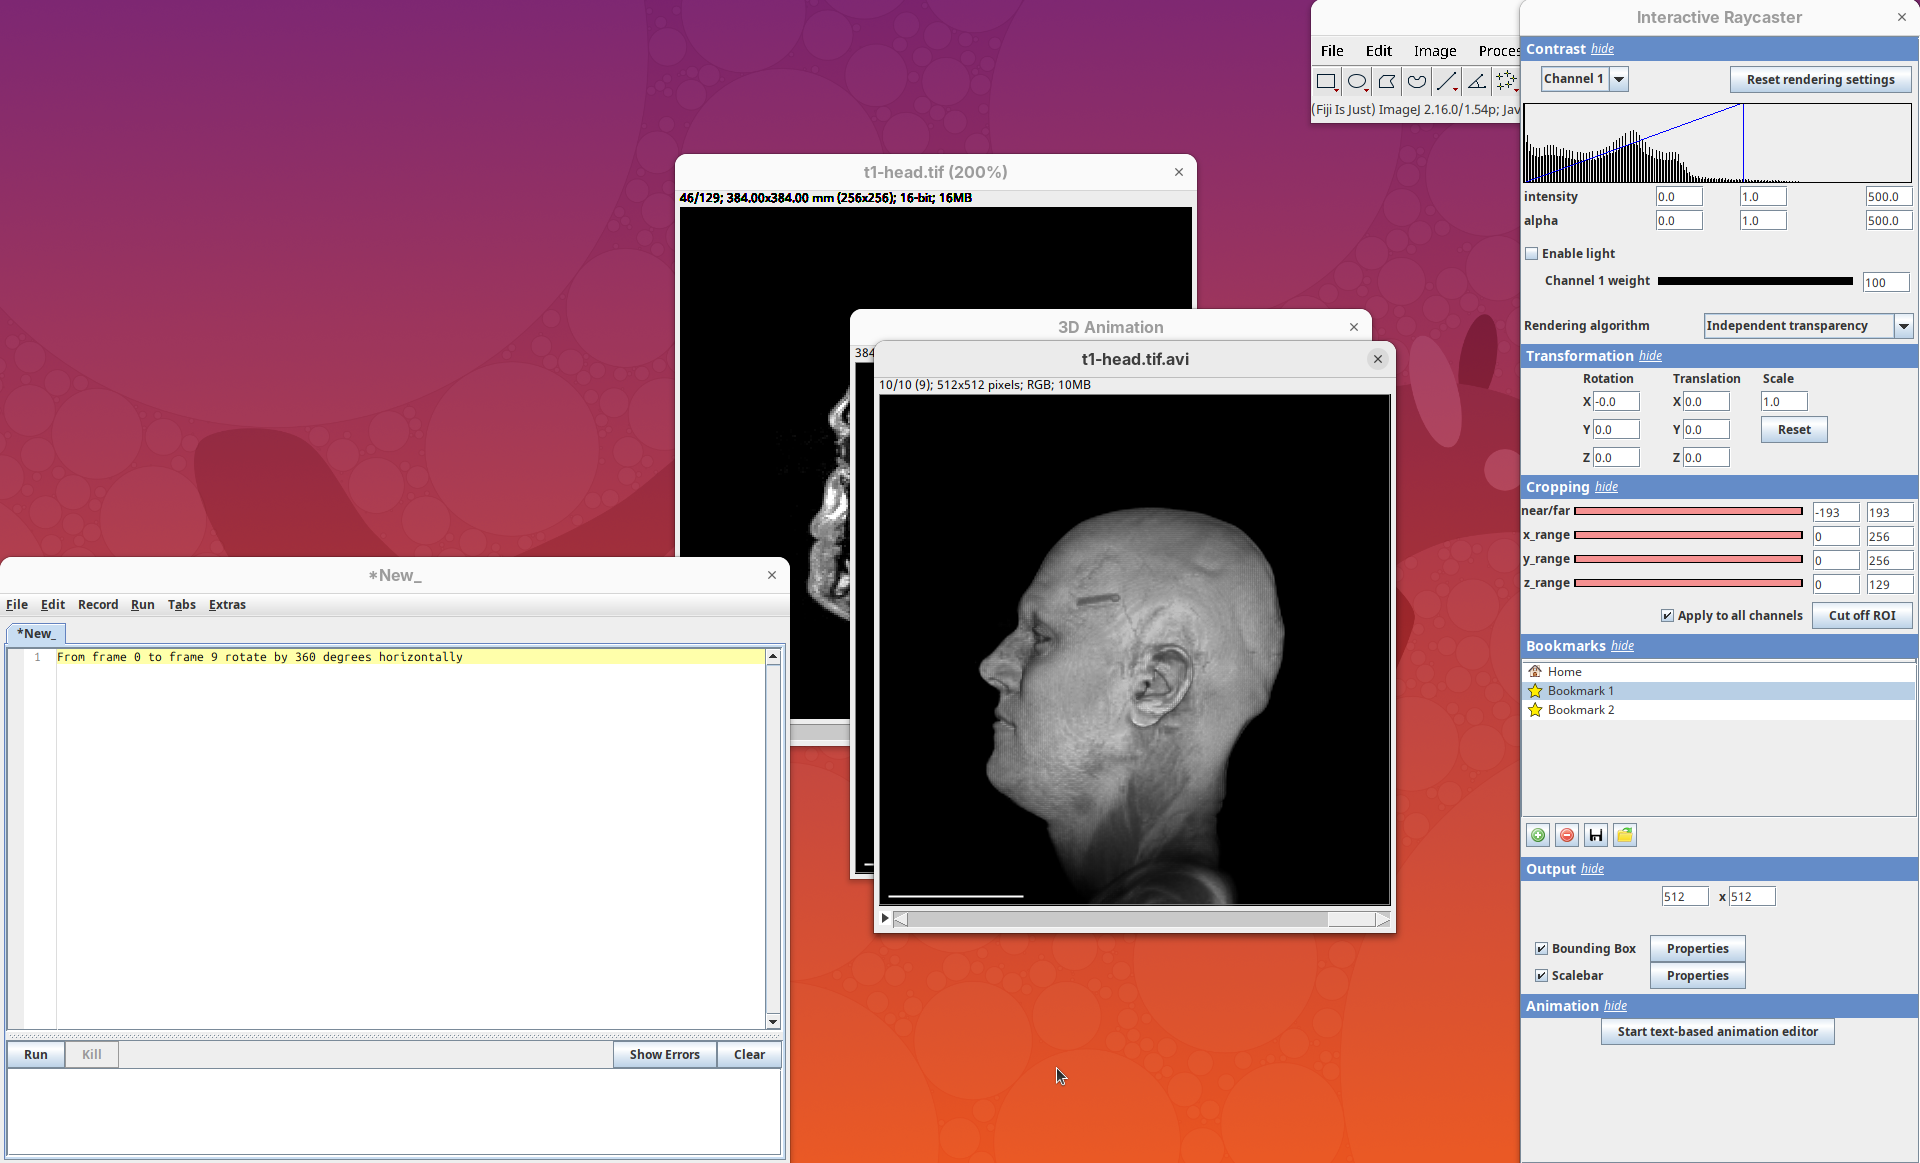
- Press play or and watch the head turn 360 degrees during these 10 frames.
Note that we did not need to define how many degrees the head would turn for each frame. We can simply state that we need the head to turn 360 in these 10 frames and 3Dscript will deal with it.
Make it smoother
Our first animation is cool, but a bit jumpy. To make it smoother we can add more frames.
- Change the final frame from
9to35, so that the animation will have 36 frames in total.
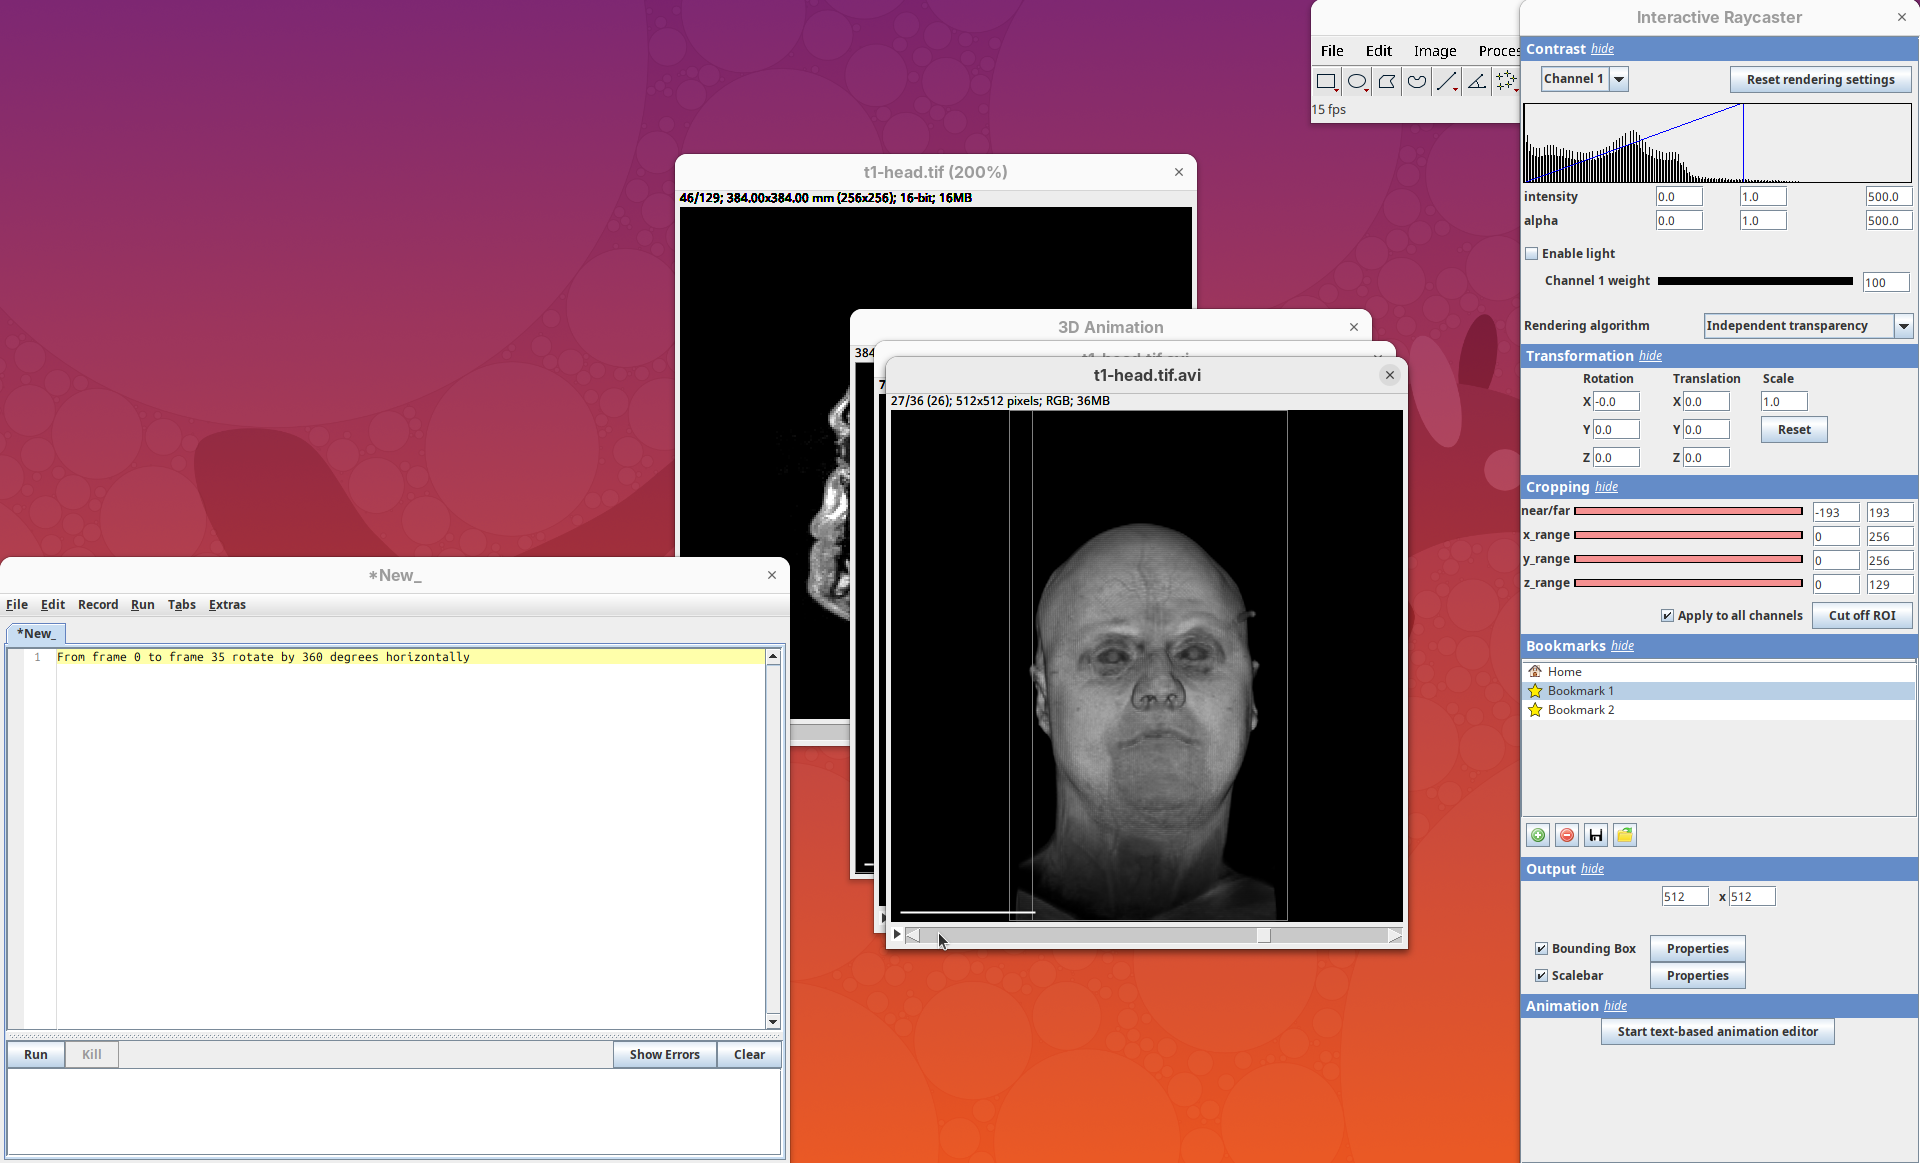
Now each frame rotates by 1 degree and the animation is much smoother.
Add easing
The standard animation creates a linear rotation; every frame turns a fixed number of degrees. 3Dscript can add easing to create non-linear transitions by accelerating or decelerating the rotation.
- Type
easeat the end of the script sentence:
From frame 0 to frame 35 rotate by 360 degrees horizontally ease- Then, press
Run.
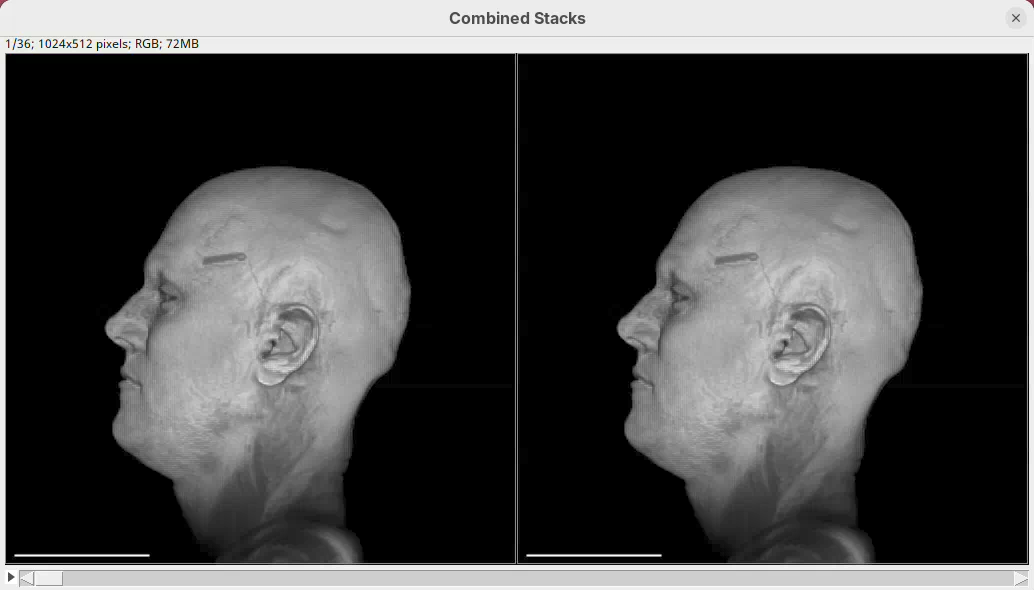
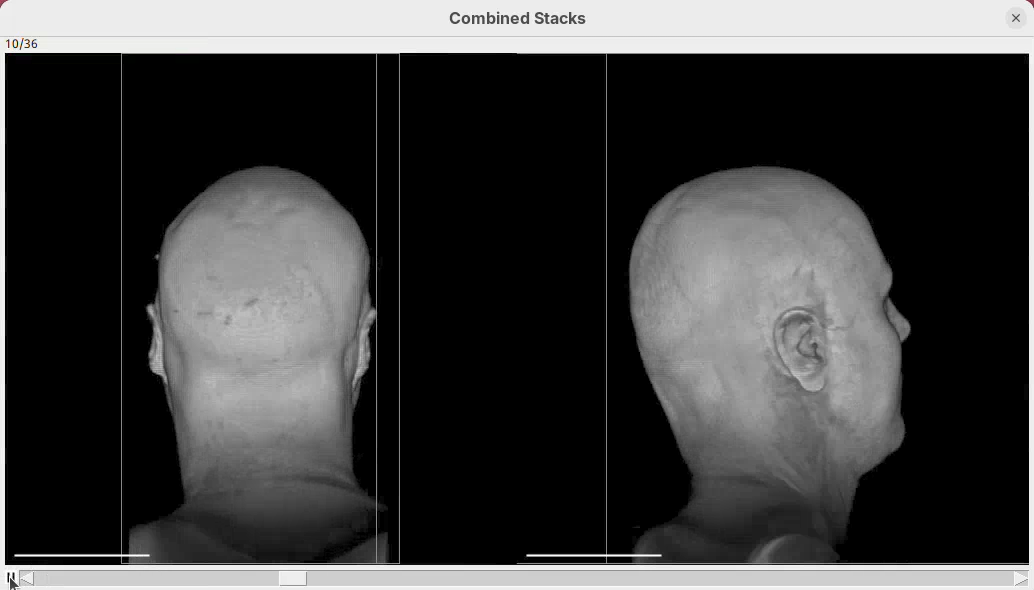
The left head is the one without easing (linear transition) and the right head is the animation with easing. Note how the right head accelerates the rotation at the beginning, turning much faster, and then decelerates towards the end of the rotation. Both end the rotation at the same time. Play both animations side-by-side to see the difference (it’s very clear, once you see it).
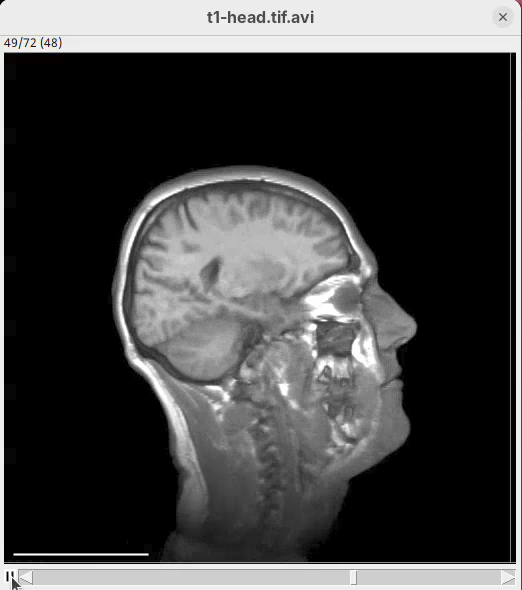
Animate cropping
Let’s add a couple more commands below our rotation sentence. We want that, after the 360 degree rotation, the animation slices through the head to show the tissues inside. For that, we can change the cropping parameters to control the position of the bounding box during the animation.
- After the first sentence, write the two commands as shown below:
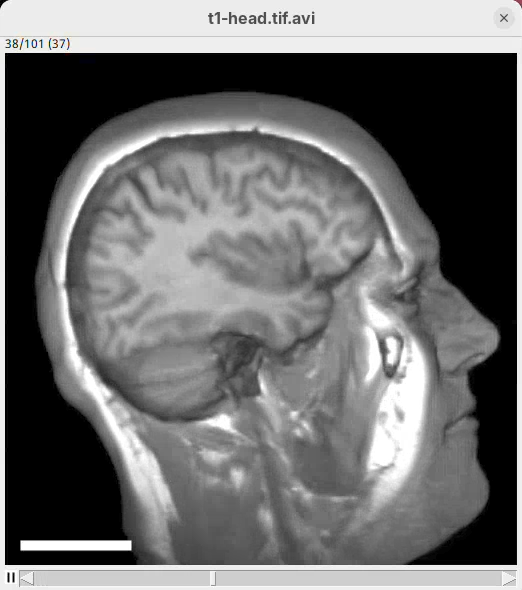
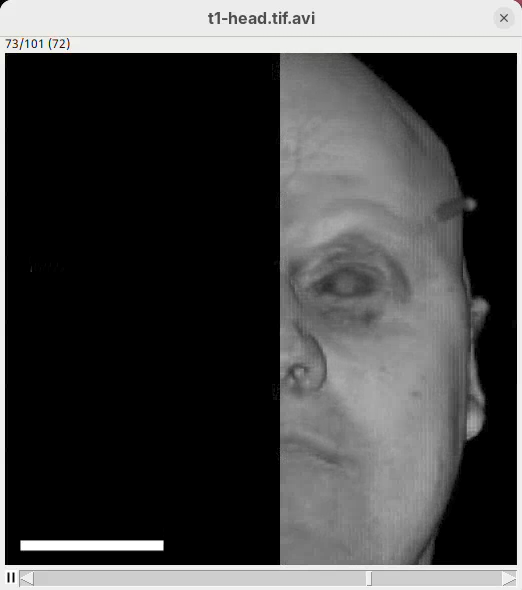
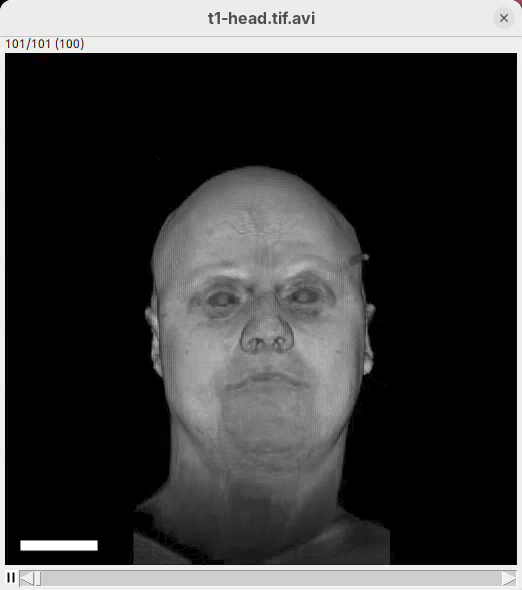
From frame 0 to frame 35 rotate by 360 degrees horizontally
From frame 36 to frame 71 change channel 1 bounding box min z to 60
From frame 72 to frame 99 change channel 1 bounding box min z to 0- Press
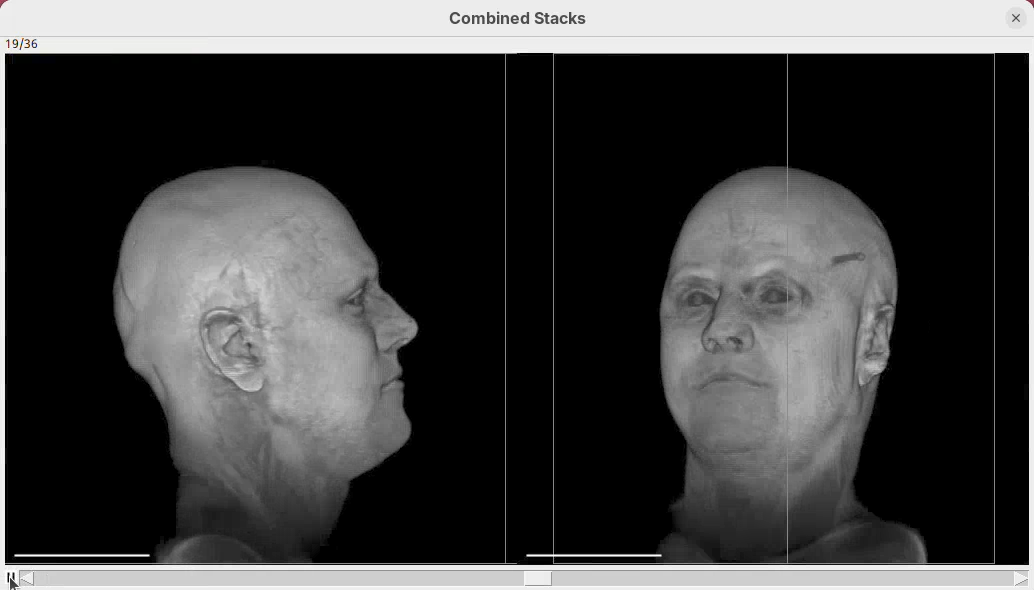
Run.
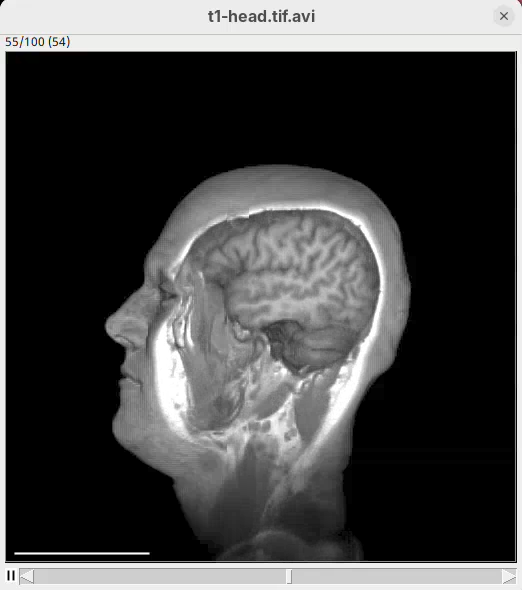
The script is saying to rotate 360 degrees horizontally, as before, set the Z range minimum to 60 (roughly halfway through the sample) for about 30 frames, and then set the Z range minimum back to 0 in the subsequent 30 frames. And that’s what we get.
Define multiple commands
Another useful 3Dscript feature is the ability to issue multiple commands to happen simultaneously, within the defined frames. For example, we can make a script that defines a horizontal rotation and Z cropping at the same time.
- Write the code below in the editor and press
Run:
From frame 0 to frame 71:
- rotate by 270 degrees horizontally
- change channel 1 bounding box max z to 60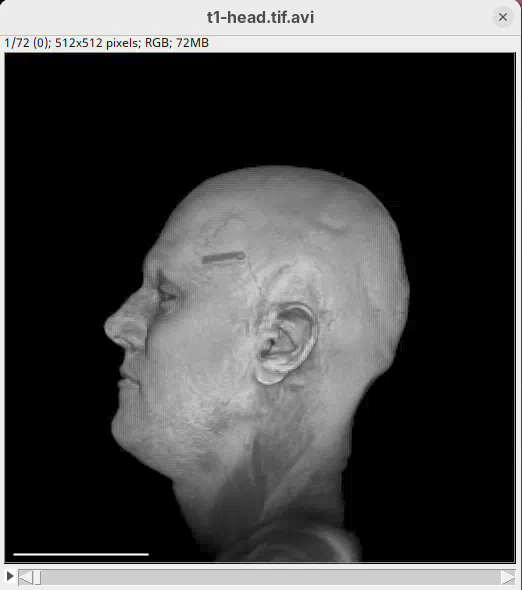
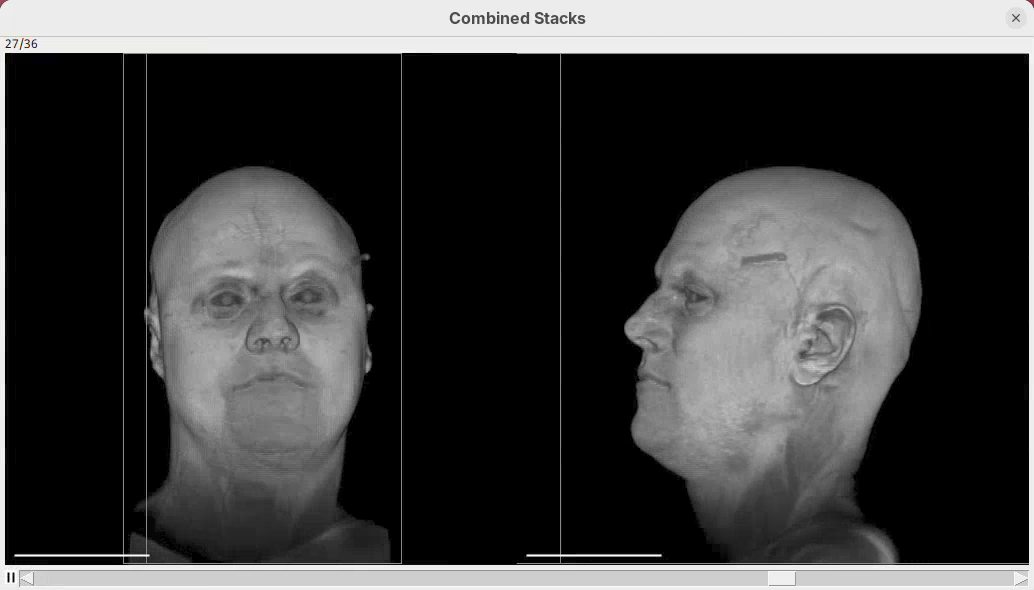
Now cropping is happening simultaneously with the rotation.
Set initial conditions
If you simply re-run the command above, the head will already start cropped. That’s because 3Dscript takes the current parameters as the initial conditions for the animation. Since the previous animation changed the bounding box without changing it back, the value remains set at the current value (cropping the head). In fact, all the options set manually in the Raycaster window will be applied to the current animation. This can cause problems if you need to generate the animation again after closing 3Dscript and can’t remember the exact parameters.
To prevent this issue, we can set the initial conditions of the animation. This is highly recommended in general, but it’s also necessary when you want to start the animation with the sample in an orientation that is different than the default sample orientation. You can set the initial conditions using the At frame 0: construction.
- Write the code below in the editor and press
Run:
At frame 0:
- rotate by 90 degrees around (0, 1, 0)
- change channel 1 bounding box z to (0, 129)

From frame 0 to frame 71:
- rotate by 150 degrees horizontally
- change channel 1 bounding box max z to 60
- zoom by a factor of 2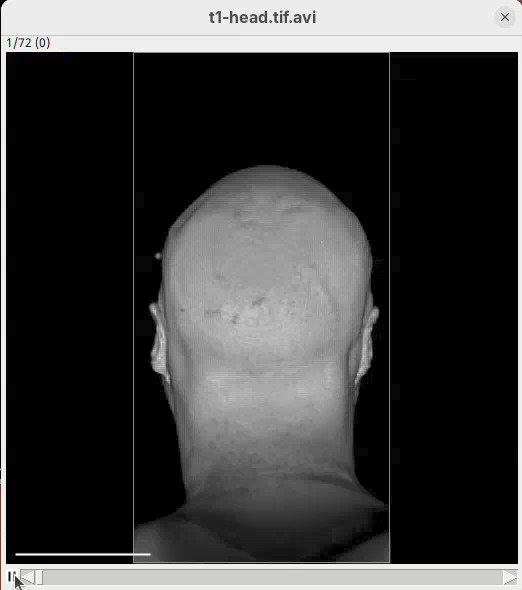
Tweak appearance
We can now also tweak the animation to reach the final appearance that we want. For example, we can change scale bar width and height and hide the bounding box lines around the sample.
- Write the code below in the editor and press
Run:
At frame 0:
- rotate by 90 degrees around (0, 1, 0)
- change channel 1 bounding box z to (0, 129)
- change bounding box visibility to off
- change scalebar length to 50
- change scalebar width to 10
- change scalebar offset to 20

From frame 0 to frame 71:
- rotate by 180 degrees horizontally
- change channel 1 bounding box max z to 60
- zoom by a factor of 2

From frame 72 to frame 100:
- change channel 1 bounding box max z to 129
- zoom by a factor of 0.5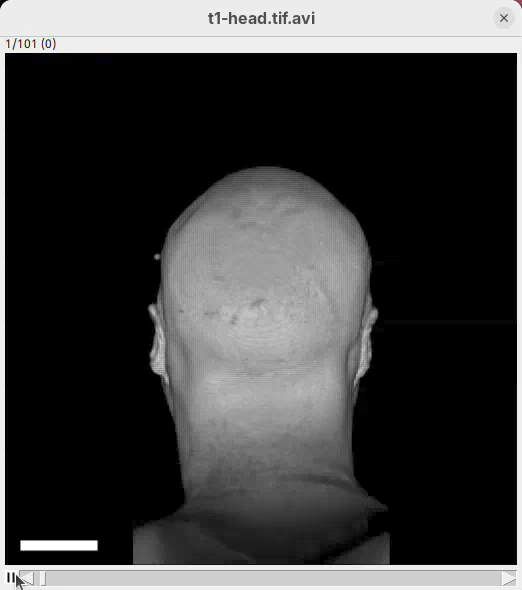
Note how there’s no longer a bounding box and the scale bar is much more visible.
This ends this part of the tutorial using a single-channel, single-timepoint dataset. Save the animation script to file for later re-use or incremental improvements.
Animation 4D
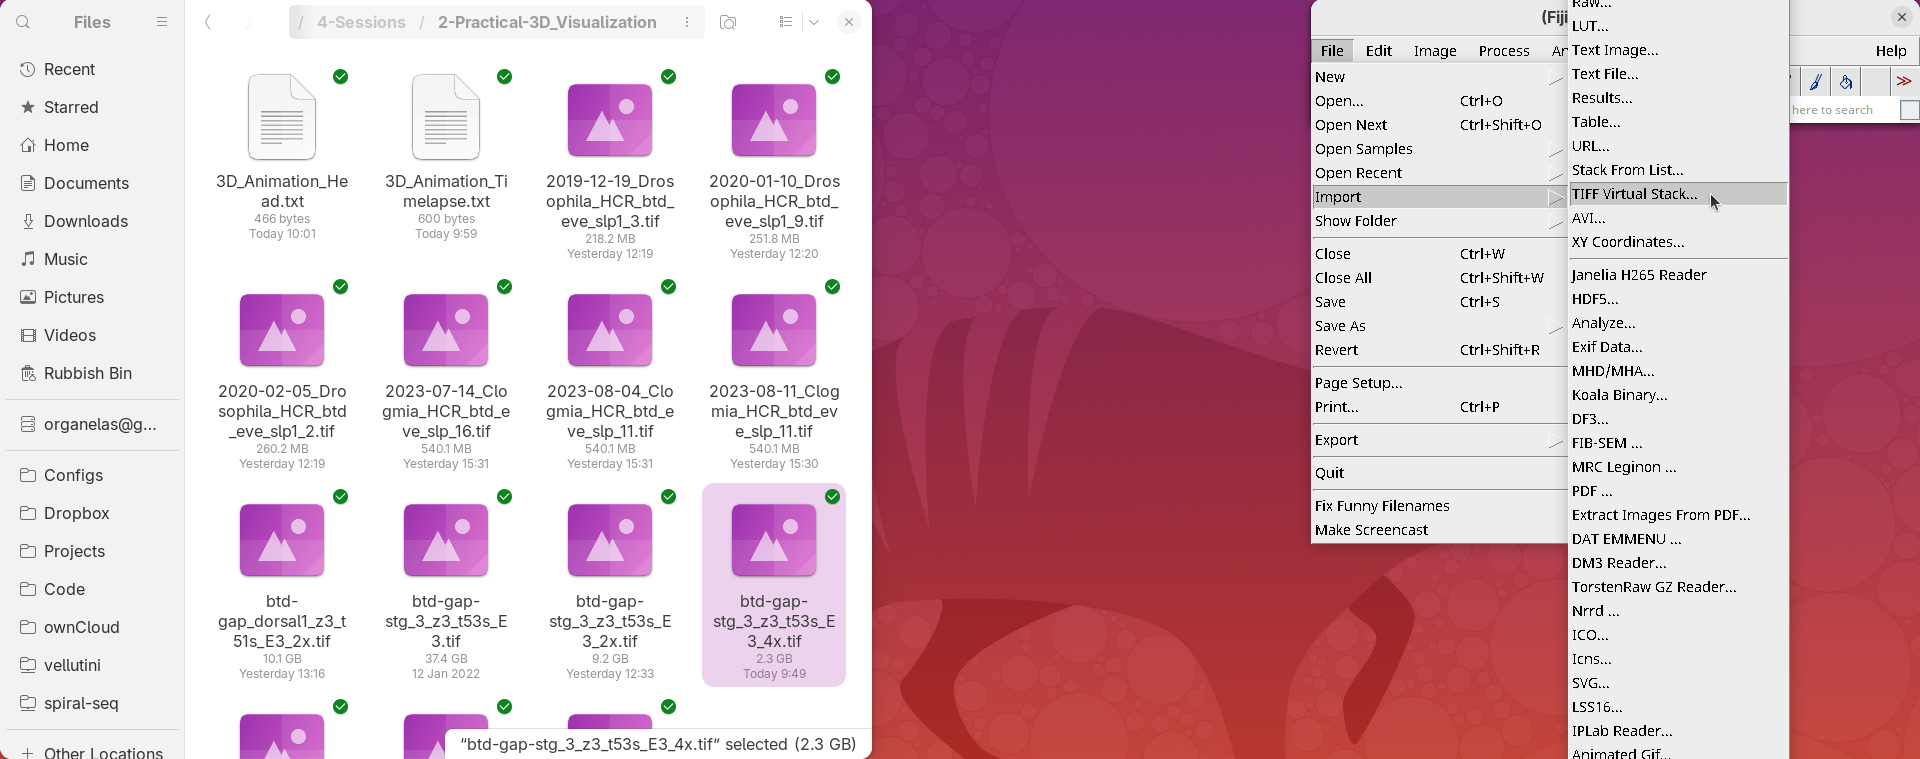
Let’s now try a more challenging sample with two channels and several timepoints. This dataset shows a fly embryo during early development. The file is named btd-gap-stg_3_z3_t53s_E3_4x.tif. It has 2 channels, 30 slices, and 200 timepoints taken every 53s. The original file size is 37GB, but here we will use the 4x downsampled dataset of 2.3GB.
Open virtual stack
Even though the original dataset would not even fit in the memory of today’s high-end laptops, we would still be able to generate animations using 3Dscript. That’s because 3Dscript works with the so-called Virtual Stacks in Fiji. This is a way to open large stacks without loading all the image data into memory (only what’s current on view is loaded). Virtual stacks are really, really great. Let’s open and inspect the new dataset as a virtual stack.
- Close all the previous 3Dscript windows (including the editor).
- Go to
File>Import>TIFF Virtual Stack...or drag and drop the file on top of the>>arrows at the right corner of the Fiji window (secret trick) to open the dataset as a virtual stack.
- Zoom in to 200% and inspect the dataset with
Orthogonal Views.
- Close the orthogonal views.
Start 3Dscript
3Dscript will use the current image dimensions to generate the animation. For this reason, it is extremely important to return the stack’s zoom to 100% before opening 3Dscript! Otherwise the upsampled data may create image artifacts.
- Open 3Dscript and zoom the
3D Animationwindow to 200% (this one is fine).
The initial 3D rendering is always showing the position and timepoint of the original stack (if you change the timepoint of the original stack and re-open 3Dscript, the current timepoint would be rendered).
- Rotate the sample interactively to see the other side, where the surface of the embryo is.
- Then, reset the transformation and change the
Rotation Yto180.
Animate timepoints
This time, before we start optimizing the rendering, we will generate a simple animation across timepoints to have an overview of how the sample changes over time. This is generally good practice as the signal of live samples tends to vary over time.
- Click on
Animation>Start text-based animation editor. - Write the initial conditions of frame 0 as shown below (set to timepoint 1 and rotate sample 180 degrees horizontally), and generate a 10-frame animation from timepoint 1 to 200 (the last).
- Then, press
Run:
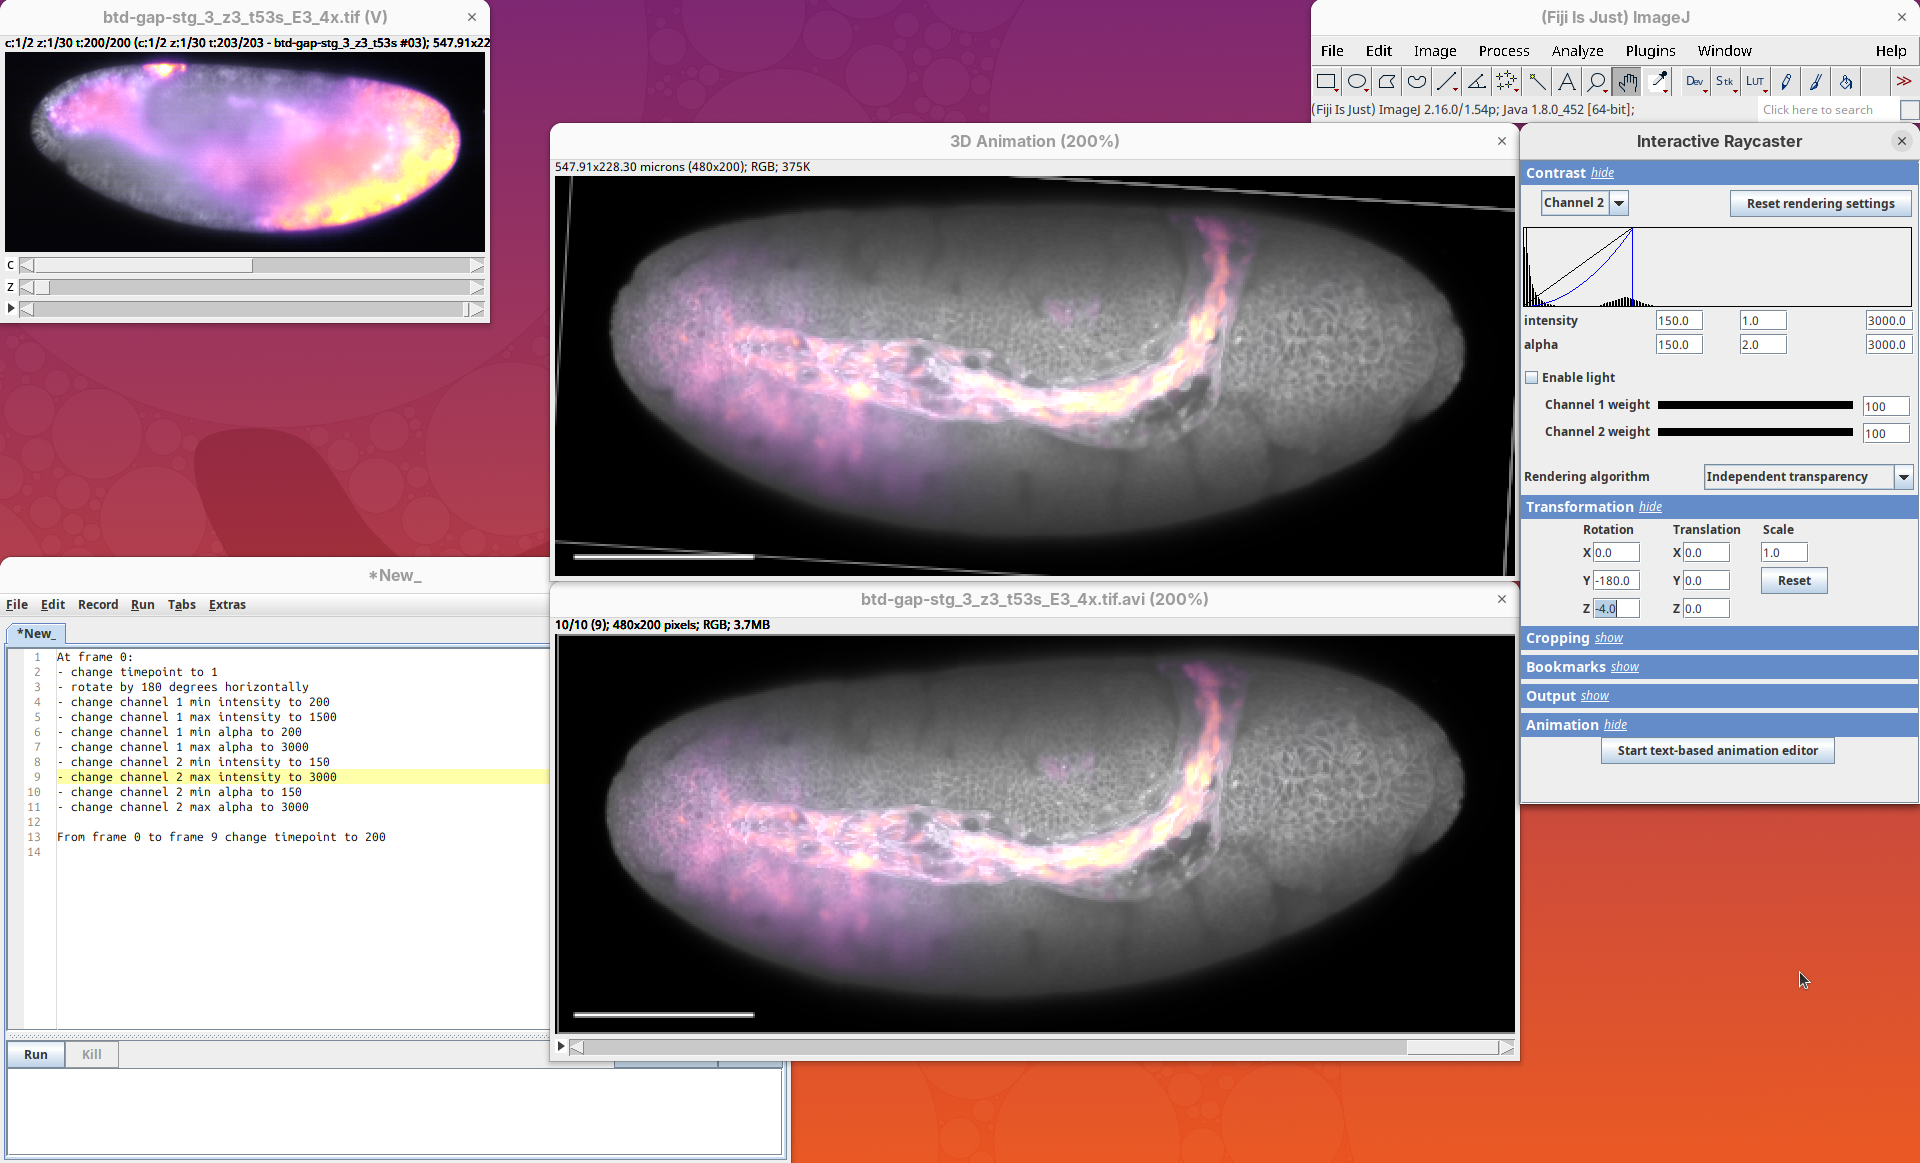
At frame 0:
- change timepoint to 1
- rotate by 180 degrees horizontally

From frame 0 to frame 9 change timepoint to 200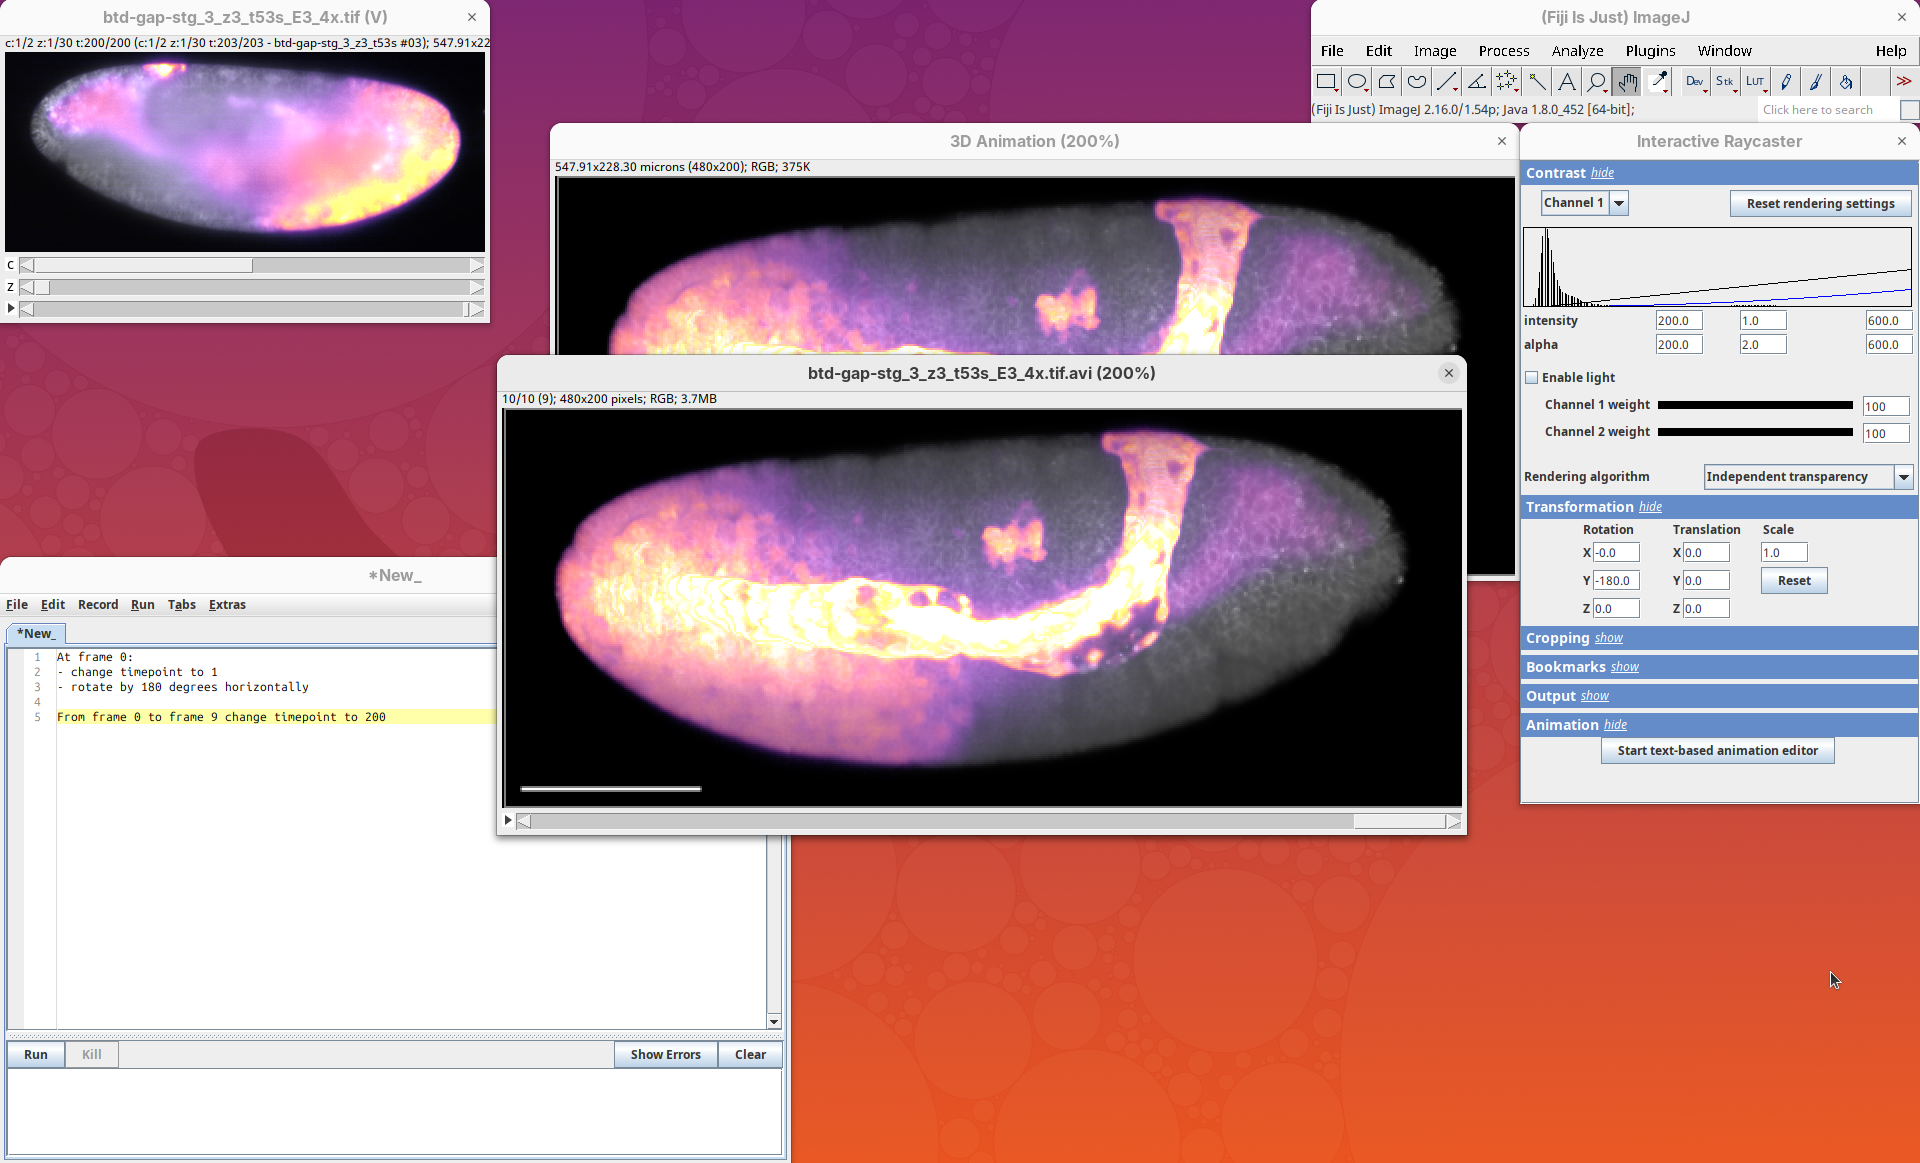
3Dscript will generate the 10-frame animation and set the 3D Animation window to the last timepoint. Unfortunately, there’s no way to set the timepoint for the 3D Animation window manually (it always shows the last timepoint of the most recent animation).
From this first animation, we can observe three things that we want to improve.
- The signal from channel 1 is overexposed in the last timepoint. The intensity of this channel changes over time. The signal becomes so strong in the last timepoints that it becomes overexposed. We will fix this.
- The signal from channel 2 is not so bright. We want to increase the contrast.
- The sample is tilted upwards (the right side is pointing up). We want to make the sample completely horizontal, parallel to the bounding box.
Adjust channel 1
- Change channel 1’s intensity and alpha maximum values from
600to1500.
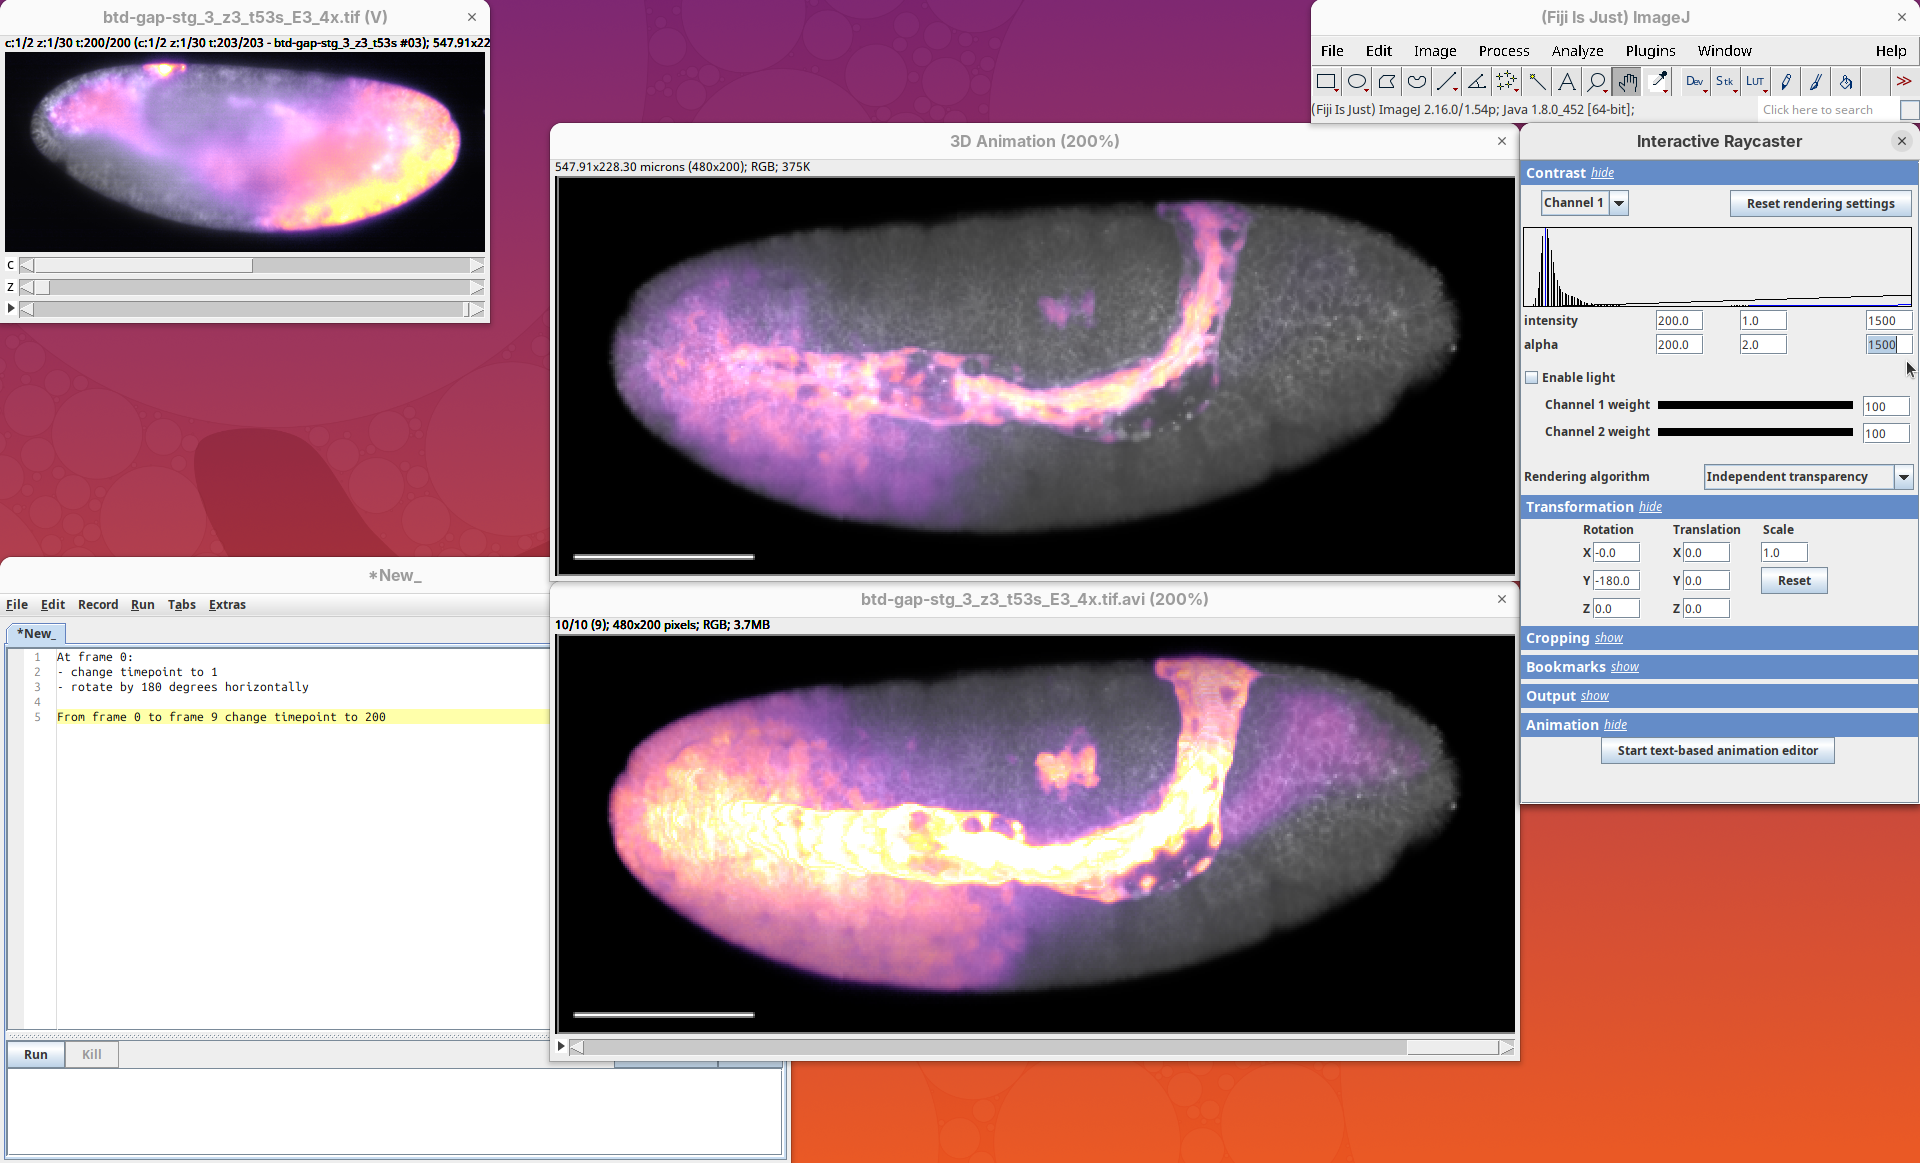
Note how the details along the bright stripe over the embryo are now more visible. As we have manually changed a Contrast value, we should add this information to the initial conditions of the animation.
- Add the new values of min/max intensity/alpha for channel 1 in the script.
- Then press
Run:
At frame 0:
- change timepoint to 1
- rotate by 180 degrees horizontally
- change channel 1 min intensity to 200
- change channel 1 max intensity to 1500
- change channel 1 min alpha to 200
- change channel 1 max alpha to 1500

From frame 0 to frame 9 change timepoint to 200
Adjust channel 2
Now we will improve the contrast of the other channel.
- Switch to channel 2 in the Contrast menu.
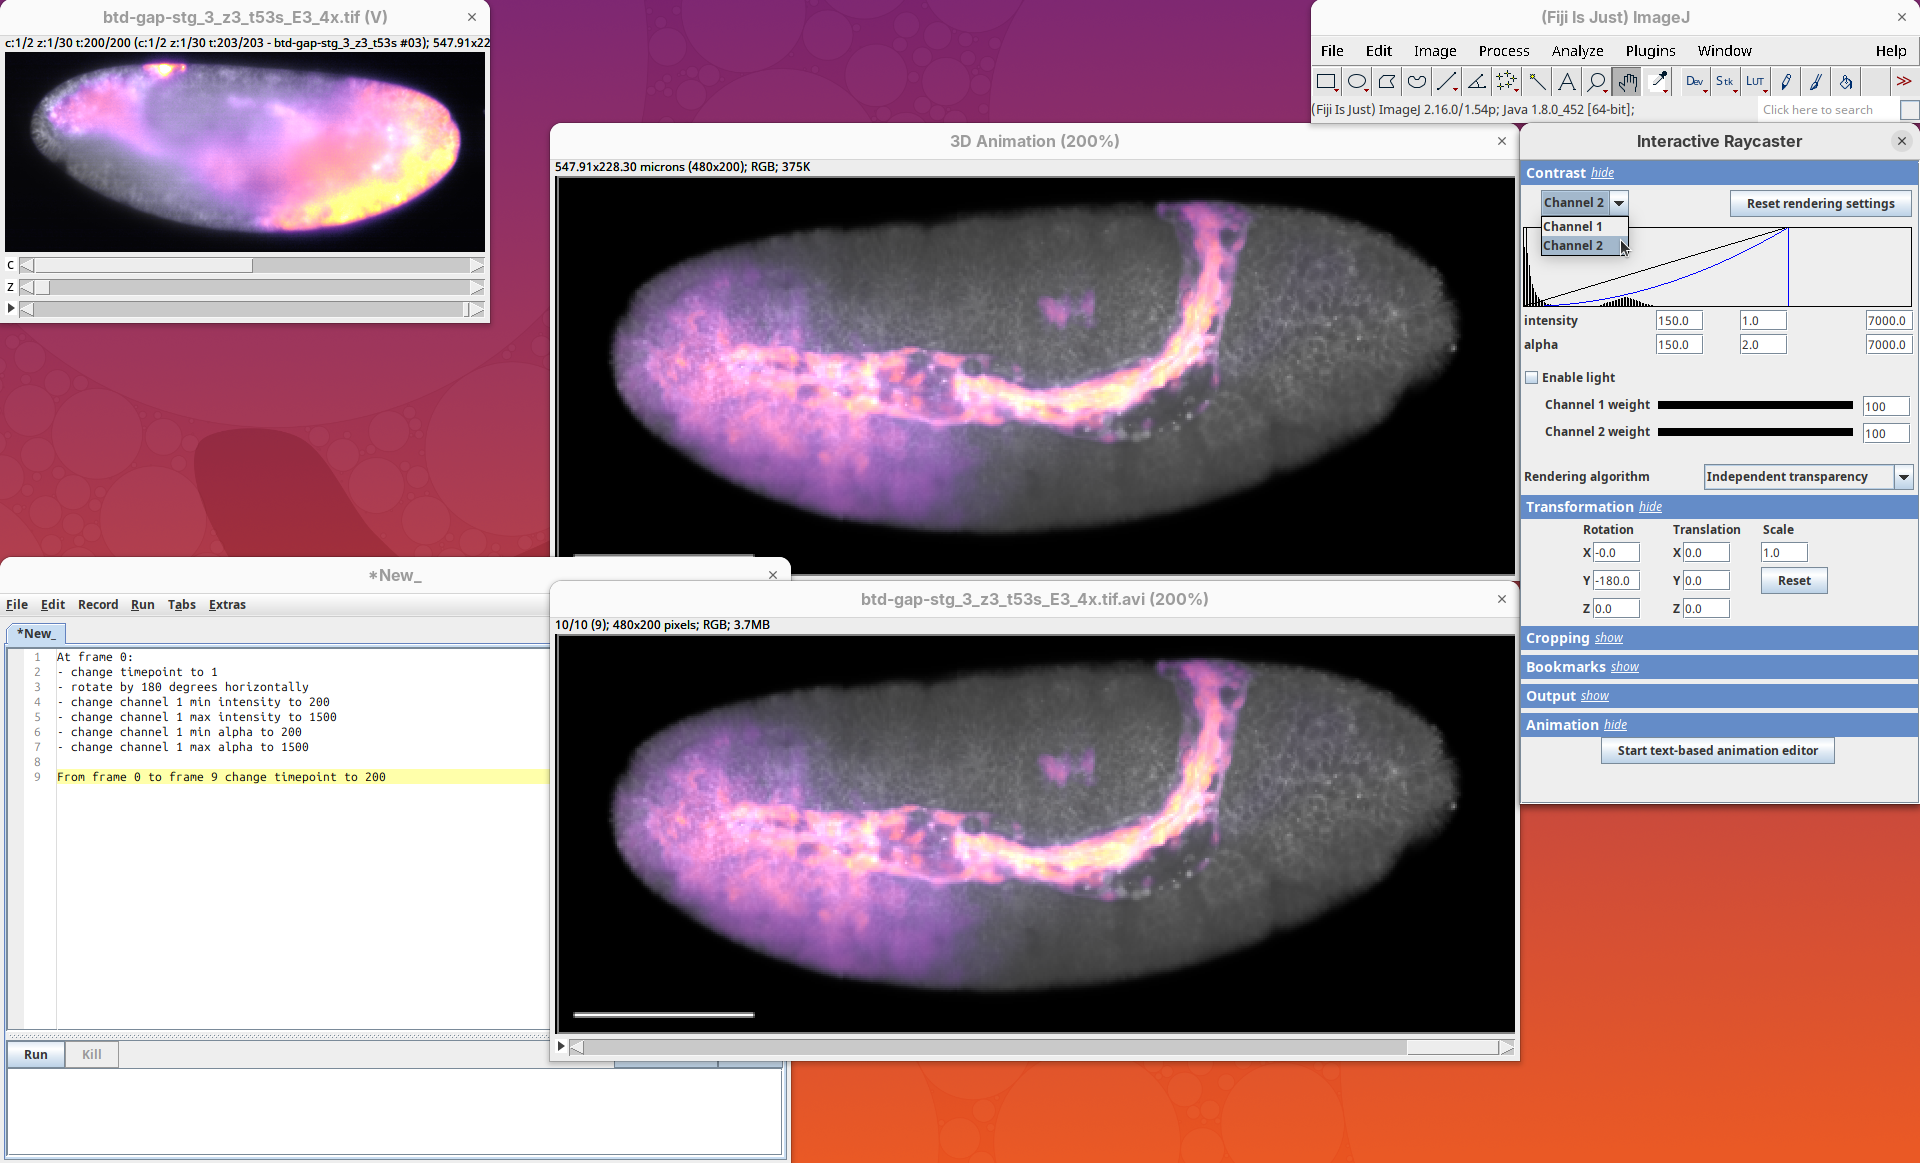
- Change channel 2’s intensity and alpha maximum values from
7000to3000.
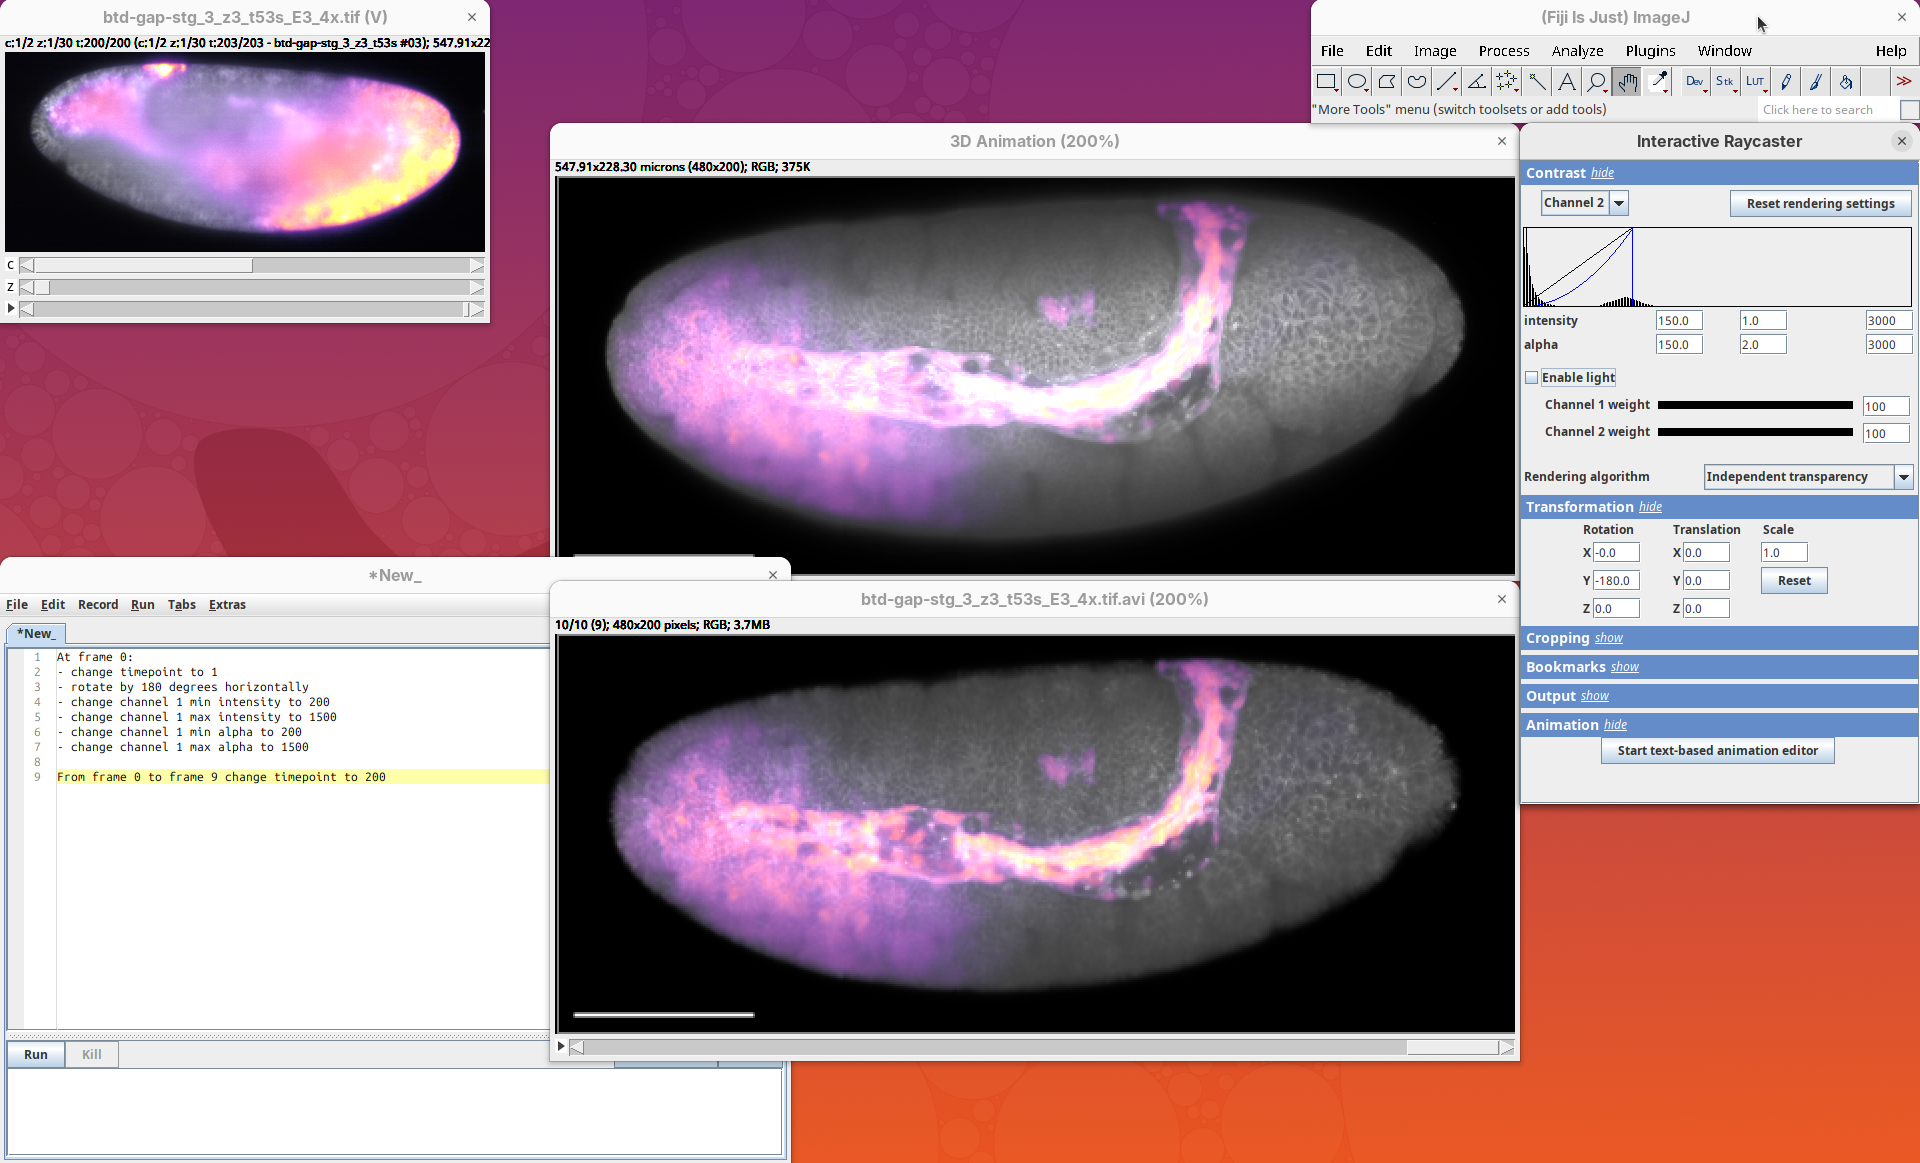
Note how the gray signal is now brighter and the sample surface looks more solid and less porous. That’s because we changed the alpha maximum value to make all the pixels above 3000 have 100% opacity.
Unfortunately, the increase in brightness of channel 2 led to some regions of channel 1 becoming a little overexposed. Before writing the new values to the code, let’s make a small correction to channel 1. We don’t want to change the intensity, but we can make the pixels more transparent, so that they don’t become so bright.
- Set channel 1’s alpha maximum value from
1500to3000. - Then, update the script as below and press
Run:
At frame 0:
- change timepoint to 1
- rotate by 180 degrees horizontally
- change channel 1 min intensity to 200
- change channel 1 max intensity to 1500
- change channel 1 min alpha to 200
- change channel 1 max alpha to 3000
- change channel 2 min intensity to 150
- change channel 2 max intensity to 3000
- change channel 2 min alpha to 150
- change channel 2 max alpha to 3000

From frame 0 to frame 9 change timepoint to 200
Great, the animation is looking nice now.
Adjust orientation
The last detail to adjust is the sample orientation around the Z axis.
- Change the
Rotation Zto-4in the Transformation menu.
The sample will become parallel to the Y axis of the window. The bounding box will appear tilted.
We can now make this change permanent.
- Add the following line to the script and press
Run:
- rotate by 4 degrees around (0, 0, 1)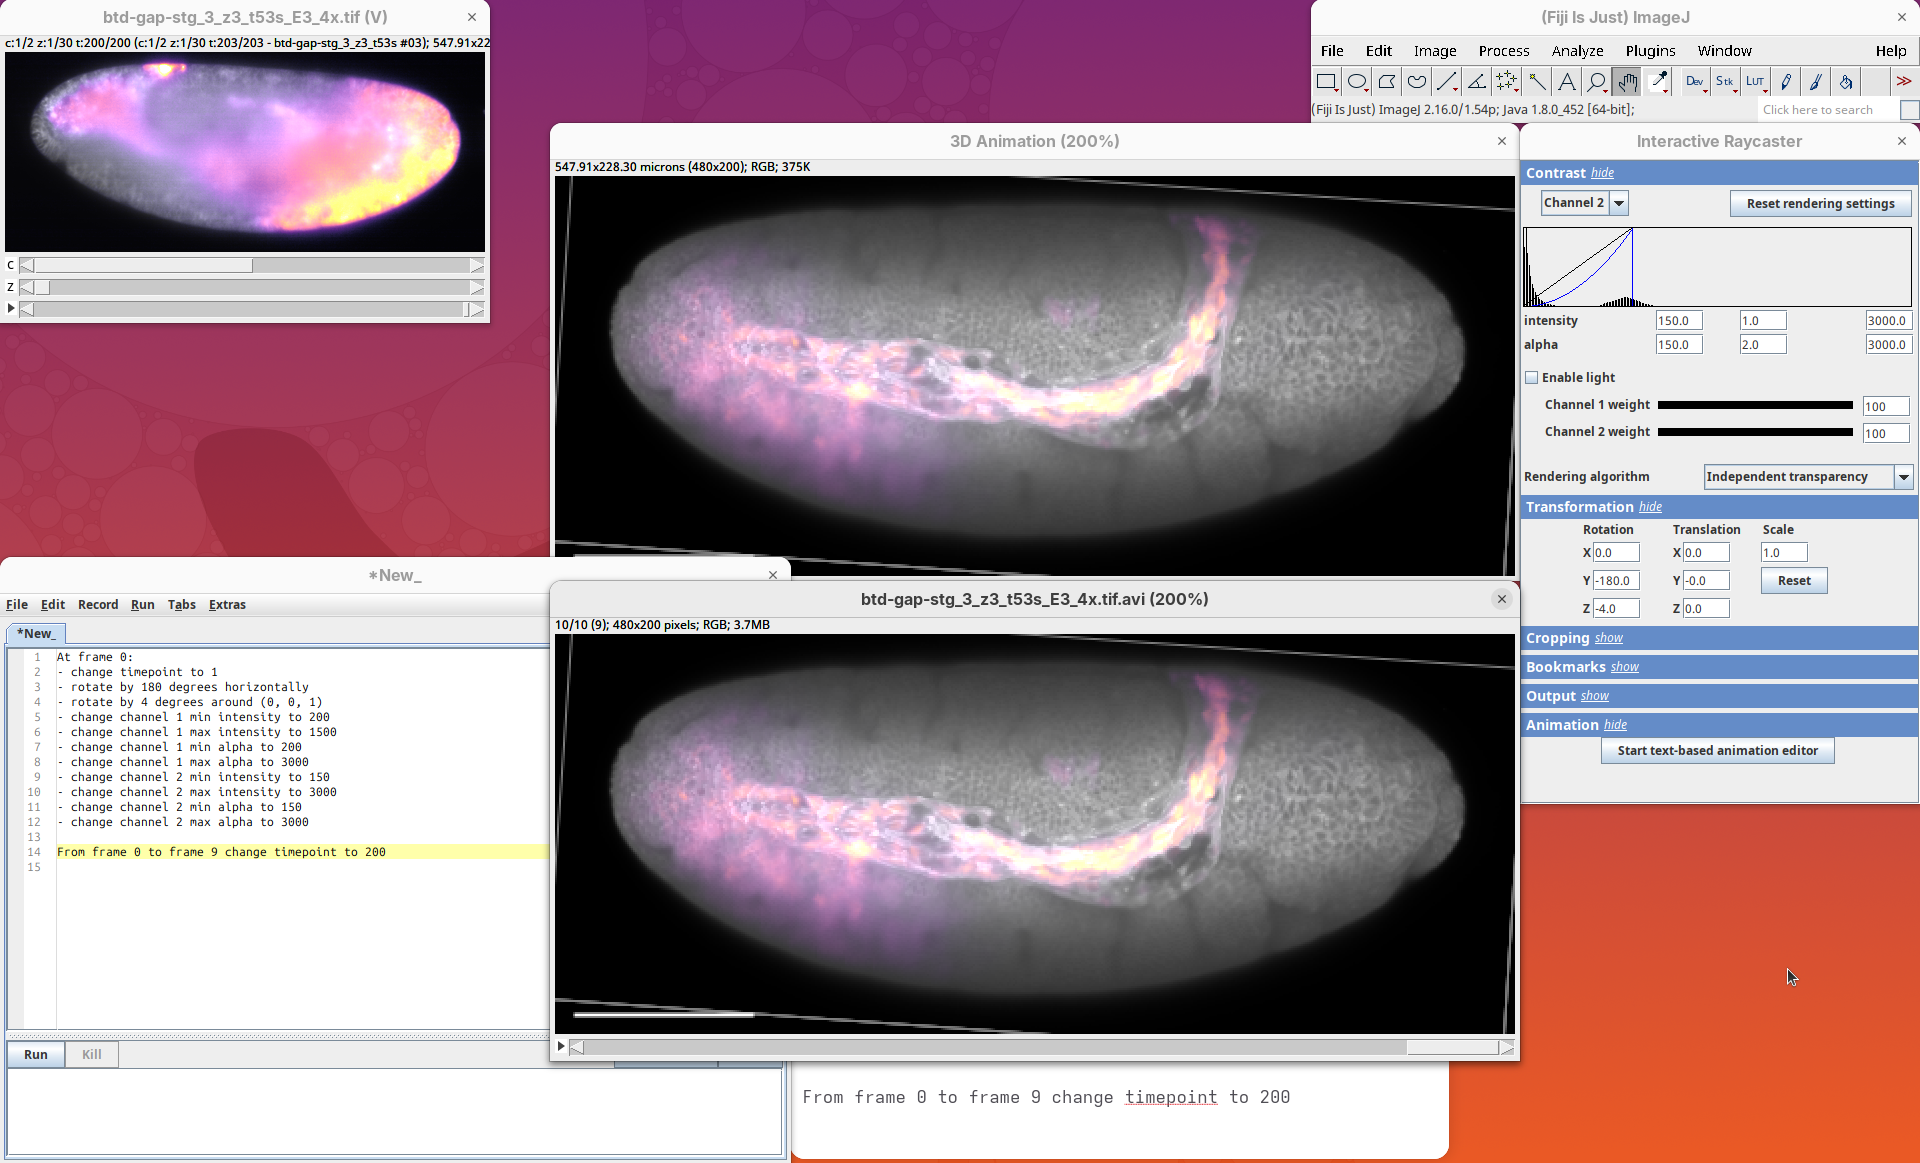
This notation is a little different, but it just means that it is rotating 4 degrees around the Z axis (X, Y, Z).
Tweak appearance
Great. The core editing is done. We can now change some general parameters of the animation like we did for the previous dataset. We want to hide the bounding box and make the scale bar more visible.
- Add the corresponding lines to the script, then press
Run:
At frame 0:
- change timepoint to 1
- rotate by 180 degrees horizontally
- rotate by 4 degrees around (0, 0, 1)
- change channel 1 min intensity to 200
- change channel 1 max intensity to 1500
- change channel 1 min alpha to 200
- change channel 1 max alpha to 3000
- change channel 2 min intensity to 150
- change channel 2 max intensity to 3000
- change channel 2 min alpha to 150
- change channel 2 max alpha to 3000
- change bounding box visibility to off
- change scalebar length to 50
- change scalebar width to 5
- change scalebar offset to 10

From frame 0 to frame 9 change timepoint to 200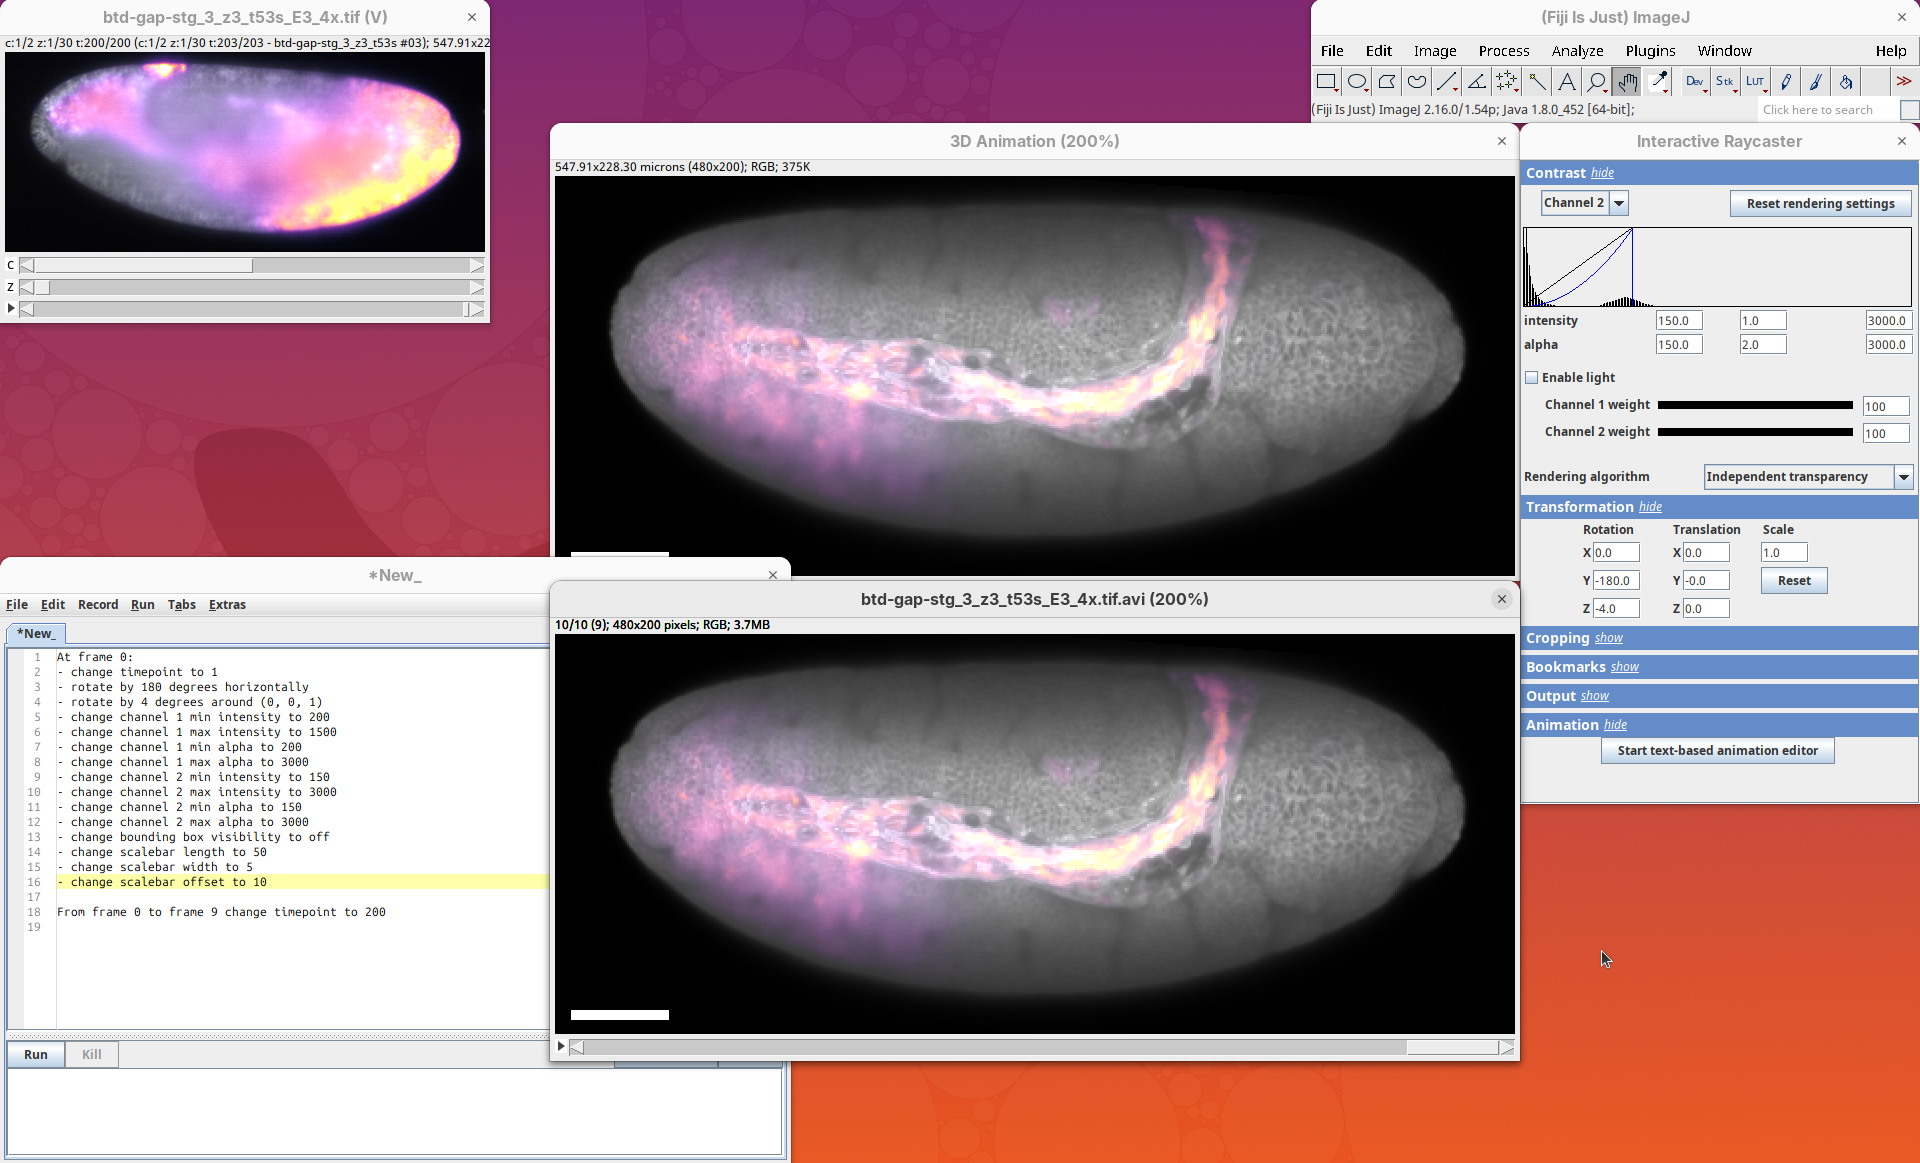
Make it smoother
We can now finish off the animation by increasing the number of frames to make it smoother. The maximum number of frames is 200, as we have 200 timepoints. If you add more frames, you’ll get duplicated frames and the animation might lag.
- Change the last frame from
9to199, then pressRun:
From frame 0 to frame 199 change timepoint to 200
Each frame is now a timepoint and the animation is as smooth as it can be, given the original data.
Save animation
We are done with this animation, let’s save it. Always save the original animation as a .tif stack.
- Press
Ctrl+SorFile>SaveorFile>Save As>Tiff....
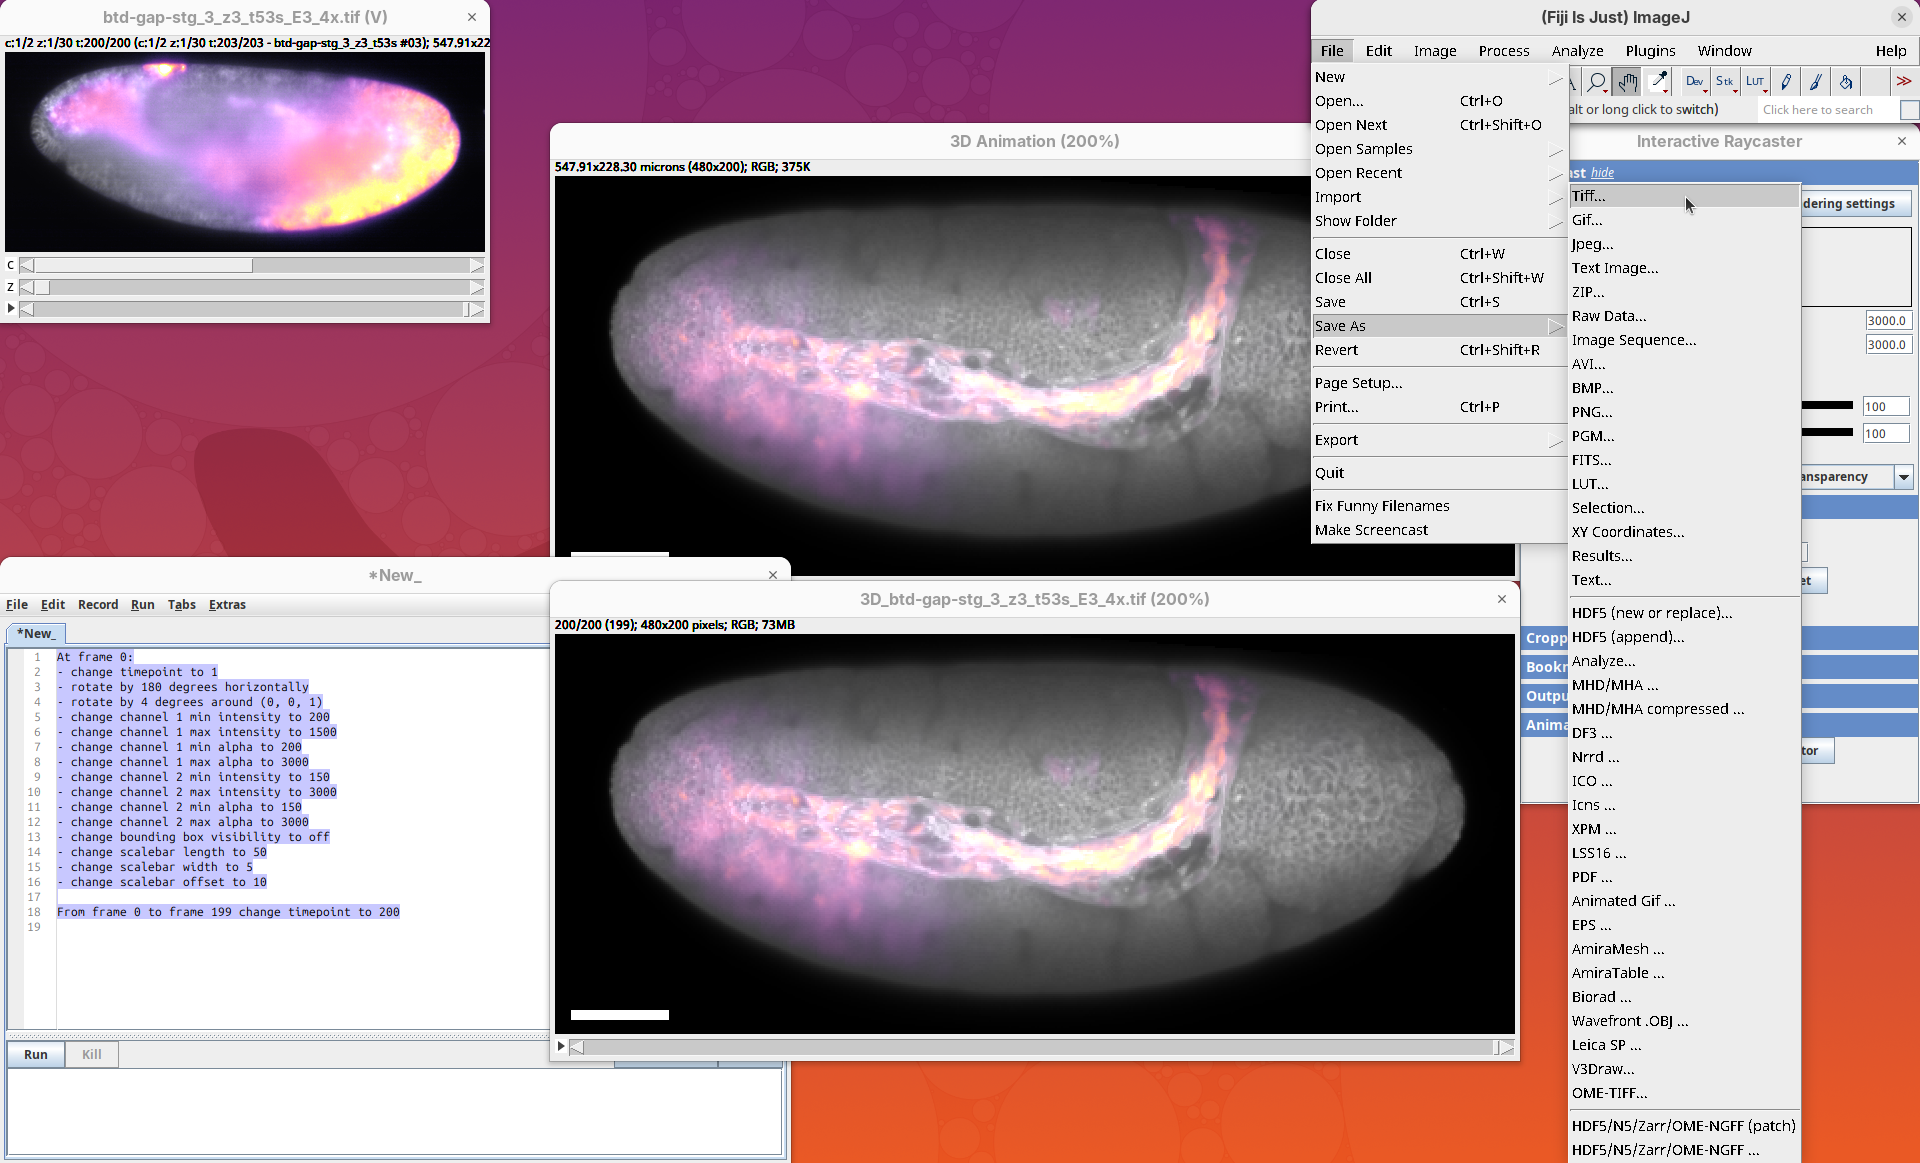
I normally add the 3D prefix to the filename.
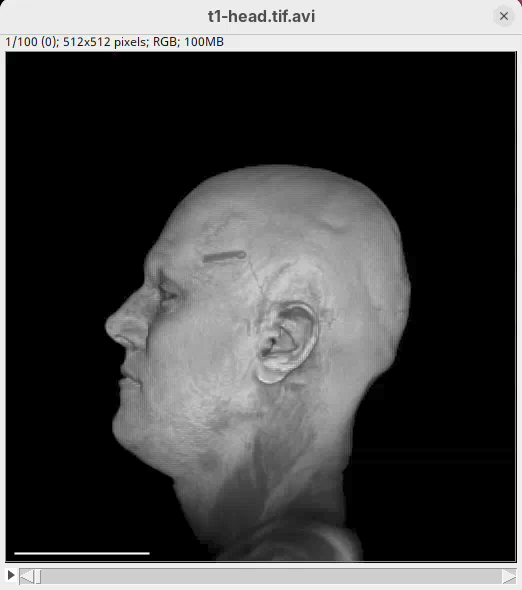
Then, also save the animation as a .avi video file.
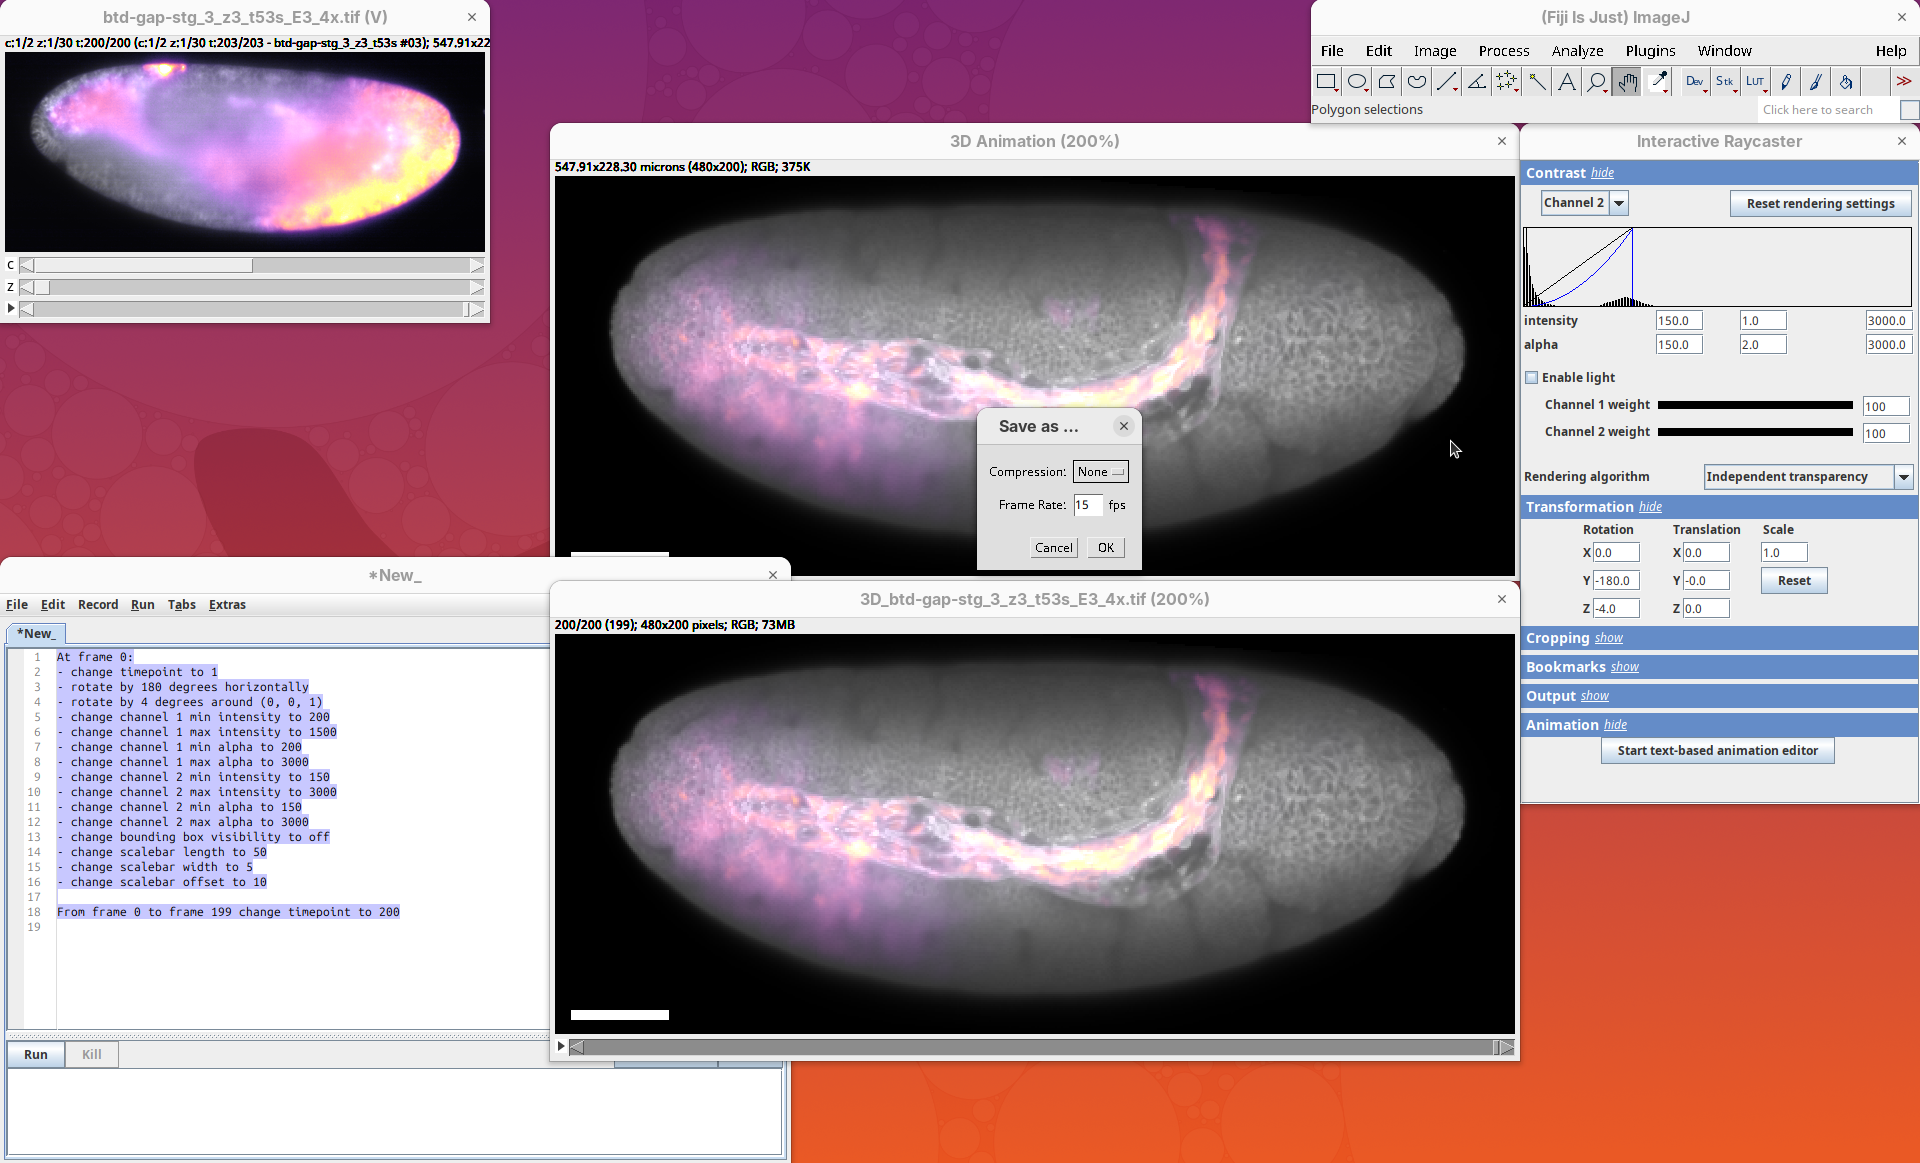
- Go to
File>Save As>AVI.... - Change the
CompressiontoNone(otherwise your image quality will be degraded) and choose the frame rate for the video (15fps works fine in this case).
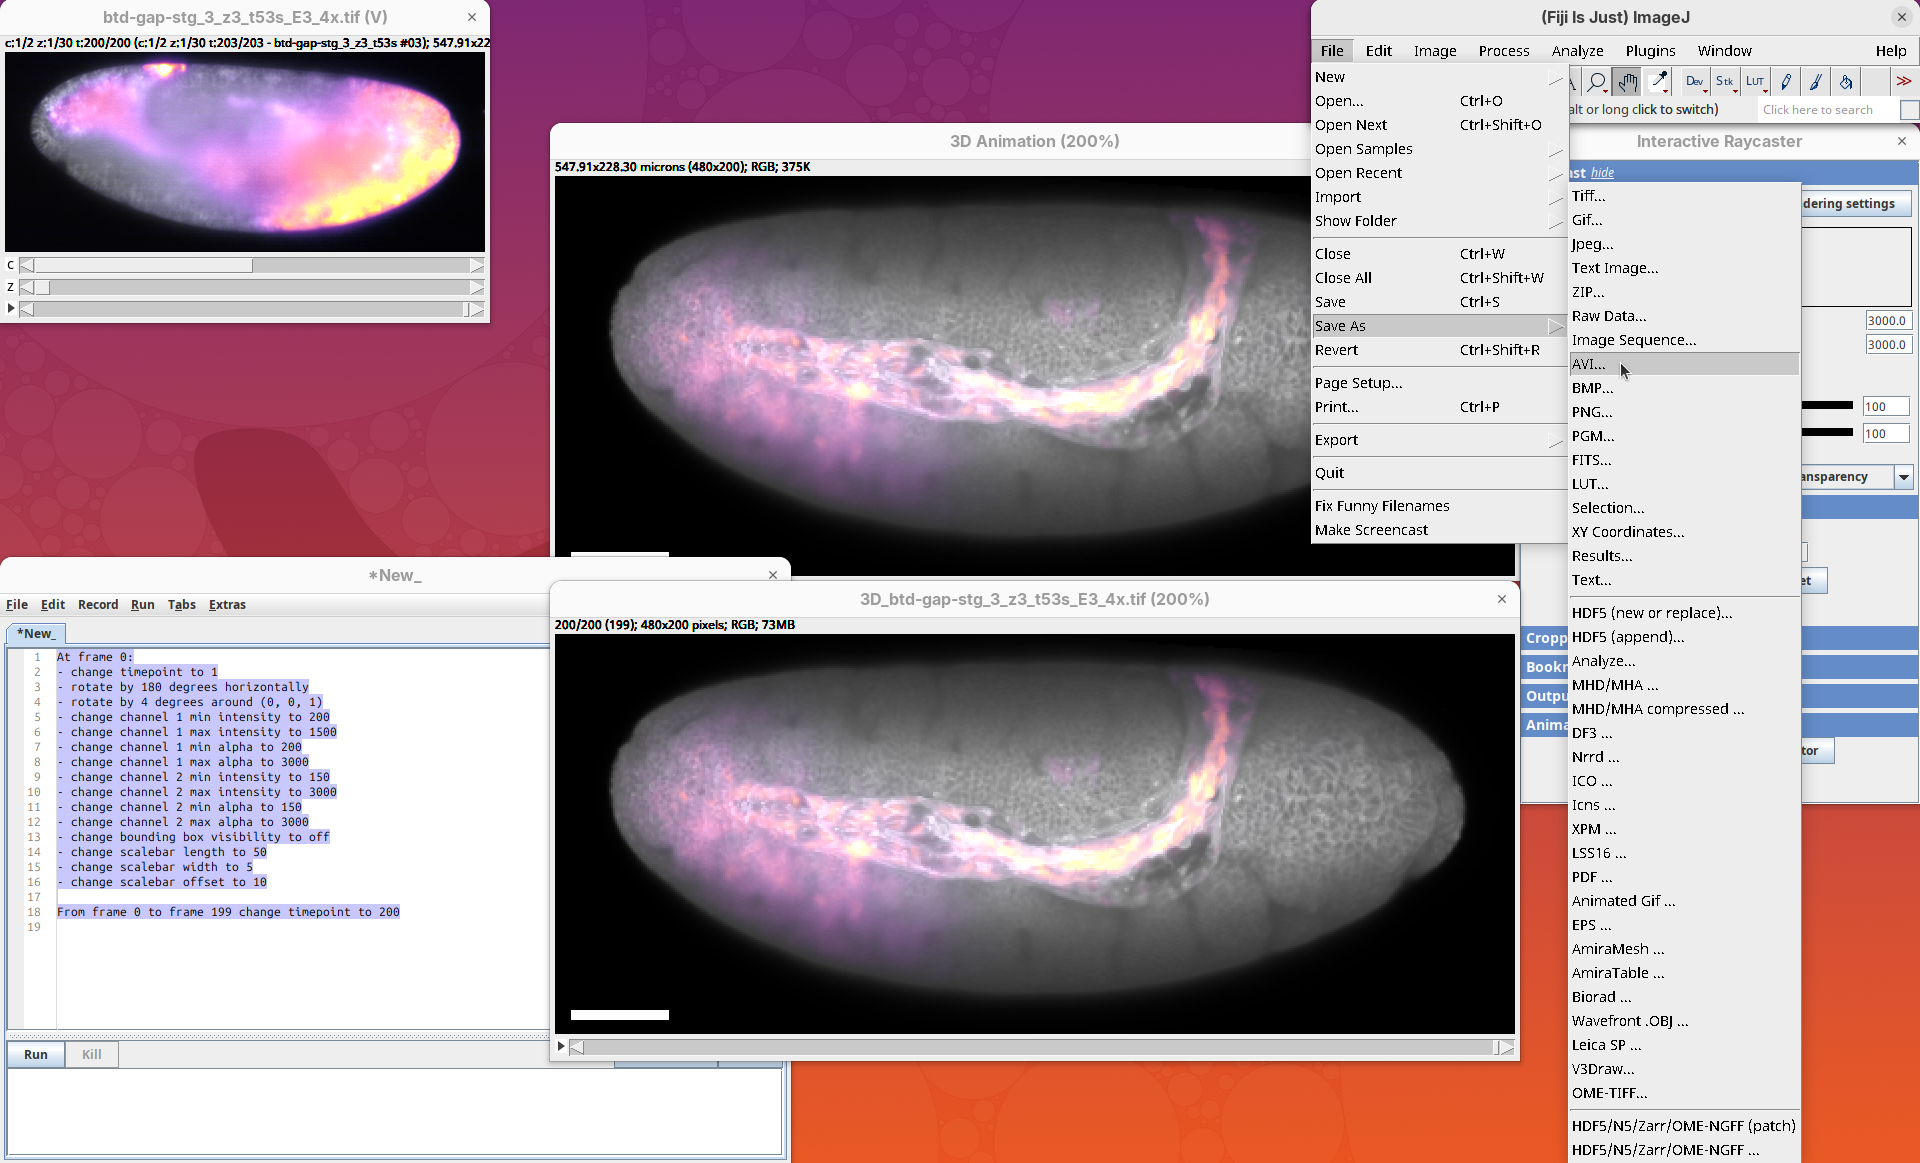
This will create an uncompressed .avi file. You can usually play this file on your video player.
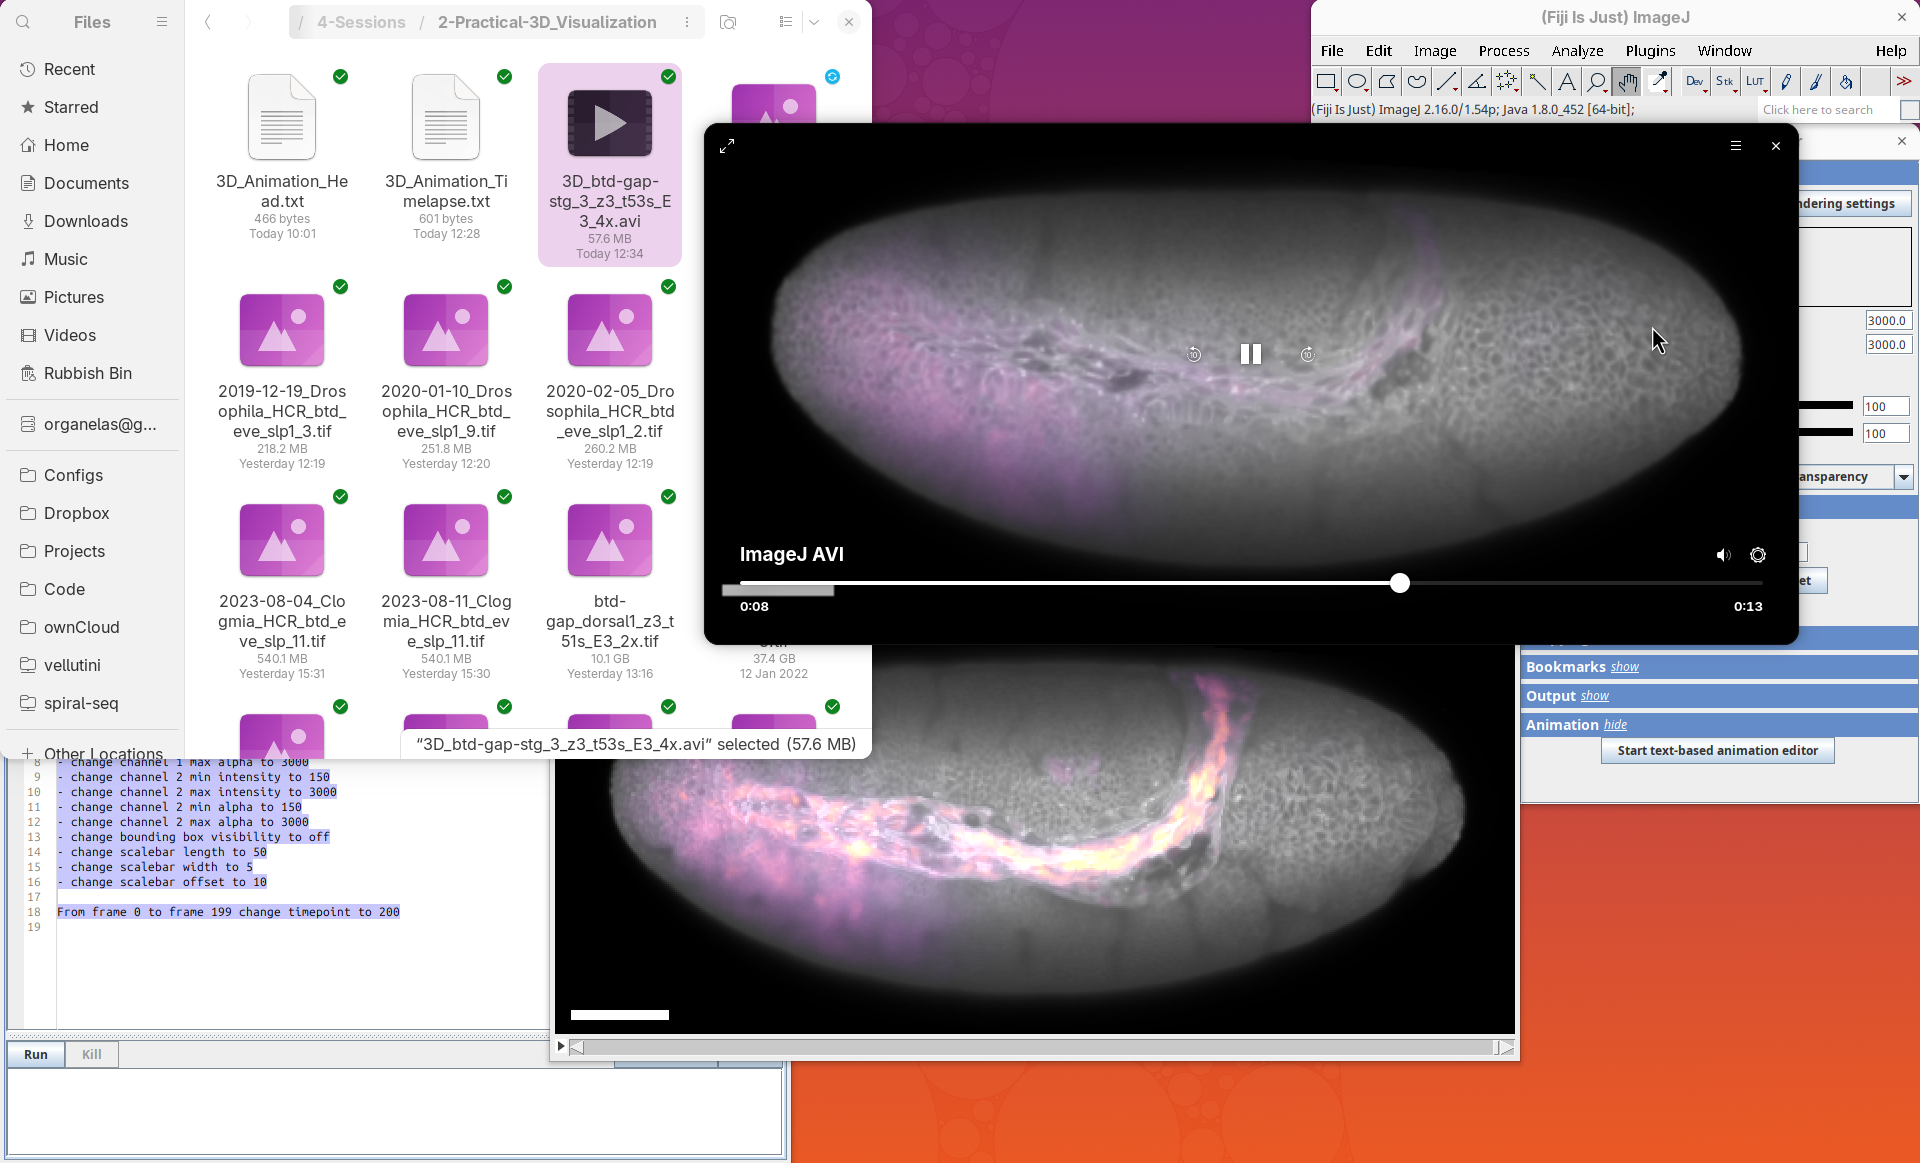
However, this video can be large. So for presentation purposes and other usages, it is good practice to compress the video into a .mp4 container using a high-quality compression parameter to reduce the file size without affecting the image quality. A good software for this is HandBrake.
Citation
Vellutini, B. C. (2026). Visualization of 3D data in Fiji using built-in tools and 3Dscript. Zenodo. https://doi.org/10.5281/zenodo.18070016
License
This tutorial is available under a Creative Commons Attribution 4.0 International License.